IBM's Attribution
人员的不稳定性,一直是困扰很多企业的一个的问题,怎么才能降低员工的离职率,留住人才呢?本文选取了IBM员工的开放数据进行研究,并通过R语言进行详细分析与结果展示。首先,通过ggplot画图,探索员工离职率与其相关的各个因素之间的关系;然后,利用RandomForest画出决策树,初步判断影响离职的相关因素;最后,建立Gradient Boosting Machines模型,从而找出对离职影响最为严重的因素,为企业留住人才、保持员工的幸福感提供建议。
数据来源:https://www.kaggle.com/pavansubhasht/ibm-hr-analytics-attrition-dataset
数据探索
插入数据
setwd('E:/RCode/')
ibm<-read.csv('IBM.csv')
str(ibm)
## 'data.frame':    1470 obs. of  35 variables:
##  $ Age                     : int  41 49 37 33 27 32 59 30 38 36 ...
##  $ Attrition               : Factor w/ 2 levels "No","Yes": 2 1 2 1 1 1 1 1 1 1 ...
##  $ BusinessTravel          : Factor w/ 3 levels "Non-Travel","Travel_Frequently",..: 3 2 3 2 3 2 3 3 2 3 ...
##  $ DailyRate               : int  1102 279 1373 1392 591 1005 1324 1358 216 1299 ...
##  $ Department              : Factor w/ 3 levels "Human Resources",..: 3 2 2 2 2 2 2 2 2 2 ...
##  $ DistanceFromHome        : int  1 8 2 3 2 2 3 24 23 27 ...
##  $ Education               : int  2 1 2 4 1 2 3 1 3 3 ...
##  $ EducationField          : Factor w/ 6 levels "Human Resources",..: 2 2 5 2 4 2 4 2 2 4 ...
##  $ EmployeeCount           : int  1 1 1 1 1 1 1 1 1 1 ...
##  $ EmployeeNumber          : int  1 2 4 5 7 8 10 11 12 13 ...
##  $ EnvironmentSatisfaction : int  2 3 4 4 1 4 3 4 4 3 ...
##  $ Gender                  : Factor w/ 2 levels "Female","Male": 1 2 2 1 2 2 1 2 2 2 ...
##  $ HourlyRate              : int  94 61 92 56 40 79 81 67 44 94 ...
##  $ JobInvolvement          : int  3 2 2 3 3 3 4 3 2 3 ...
##  $ JobLevel                : int  2 2 1 1 1 1 1 1 3 2 ...
##  $ JobRole                 : Factor w/ 9 levels "Healthcare Representative",..: 8 7 3 7 3 3 3 3 5 1 ...
##  $ JobSatisfaction         : int  4 2 3 3 2 4 1 3 3 3 ...
##  $ MaritalStatus           : Factor w/ 3 levels "Divorced","Married",..: 3 2 3 2 2 3 2 1 3 2 ...
##  $ MonthlyIncome           : int  5993 5130 2090 2909 3468 3068 2670 2693 9526 5237 ...
##  $ MonthlyRate             : int  19479 24907 2396 23159 16632 11864 9964 13335 8787 16577 ...
##  $ NumCompaniesWorked      : int  8 1 6 1 9 0 4 1 0 6 ...
##  $ Over18                  : Factor w/ 1 level "Y": 1 1 1 1 1 1 1 1 1 1 ...
##  $ OverTime                : Factor w/ 2 levels "No","Yes": 2 1 2 2 1 1 2 1 1 1 ...
##  $ PercentSalaryHike       : int  11 23 15 11 12 13 20 22 21 13 ...
##  $ PerformanceRating       : int  3 4 3 3 3 3 4 4 4 3 ...
##  $ RelationshipSatisfaction: int  1 4 2 3 4 3 1 2 2 2 ...
##  $ StandardHours           : int  80 80 80 80 80 80 80 80 80 80 ...
##  $ StockOptionLevel        : int  0 1 0 0 1 0 3 1 0 2 ...
##  $ TotalWorkingYears       : int  8 10 7 8 6 8 12 1 10 17 ...
##  $ TrainingTimesLastYear   : int  0 3 3 3 3 2 3 2 2 3 ...
##  $ WorkLifeBalance         : int  1 3 3 3 3 2 2 3 3 2 ...
##  $ YearsAtCompany          : int  6 10 0 8 2 7 1 1 9 7 ...
##  $ YearsInCurrentRole      : int  4 7 0 7 2 7 0 0 7 7 ...
##  $ YearsSinceLastPromotion : int  0 1 0 3 2 3 0 0 1 7 ...
##  $ YearsWithCurrManager    : int  5 7 0 0 2 6 0 0 8 7 ...
加载需要的包
#install.packages('grid')
#install.packages('gridExtra')
#install.packages('ggplot2')
library(grid)
library(gridExtra)
library(ggplot2)
探索Attrition和Gender、Age之间的关系
ggplot(ibm, aes(x= Gender, y=Age, group = Gender, fill = Gender)) +
  geom_boxplot(alpha=0.7) +
  theme(legend.position="none") +
  facet_wrap(~ Attrition) +
  ggtitle("Attrition") +
  theme(plot.title = element_text(hjust = 0.5))+
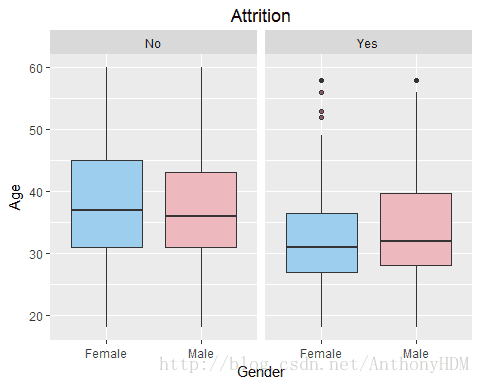
scale_fill_manual(values = c("#7EC0EE","#EEA2AD"))- 从图中可以看出离职情况和年龄是有一定关系的,(1)离职的人年龄普遍较小,这很符合现实,刚开始就业的人群都会在不断更换工作中找到最适合自己的职业,直到找到了就不再更换职业;(2)少部分离职的人年龄极大,本文推测是因为推出导致的离职。
- 从图中也可以看出离职情况和性别关系是不大的。
探索Attrition和WorkLifeBalance、DistanceFromHome之间的关系
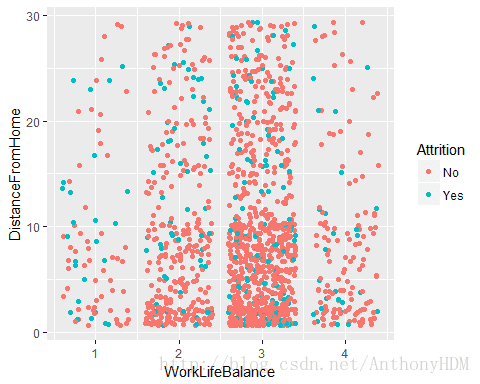
ggplot(ibm,aes(WorkLifeBalance,DistanceFromHome,color=Attrition))+geom_point(position = 'jitter')+scale_fill_manual(values = c("#7EC0EE","#EEA2AD"))- 从公司到家里距离的以及生活幸福的平衡情况两个维度看,所有离职的数据点基本上是均匀分布的,所以距离和平衡度对离职情况并不产生重要影响
- 图中也反映了一个真实情况,家里距离公司近的员工人数较多
探索Attrition与Education、EducationField之间的关系
levels(ibm$EducationField) <- c("HR", "LS", "MRK", "MED", "Oth", "TD")
p5 <- ggplot(ibm, aes(x = Education, fill = Attrition)) +
  geom_histogram(stat="count")+scale_fill_manual(values = c("#7EC0EE","#EEA2AD"))+coord_flip()
p6 <- ggplot(ibm, aes(x = EducationField, fill = Attrition)) +
  geom_histogram(stat="count")+scale_fill_manual(values = c("#7EC0EE","#EEA2AD"))+coord_flip()
grid.arrange(p5, p6, ncol = 1, nrow = 2)- 从图中可以看到,教育程度和离职情况有一定关系,离职率随着教育程度的不断增加先呈增加趋势再降低
- 从图中也可以看到,教育研究领域中Life Sciences的离职率较高,HR和其他领域的离职率较低
探索Attrition与JobSatisfaction、RelationshipSatisfaction、EnvironmentSatisfaction之间的关系
s1 <- ggplot(ibm, aes(x = JobSatisfaction, fill = Attrition)) +
  geom_bar()+scale_fill_manual(values = c("#7EC0EE","#EEA2AD"))
s2 <- ggplot(ibm, aes(x = RelationshipSatisfaction, fill = Attrition)) +
  geom_bar()+scale_fill_manual(values = c("#7EC0EE","#EEA2AD"))
levels(ibm$JobRole) <- c("HC", "HR", "LT", "Man", "MD", "RD", "RS", "SE", "SR")
s3 <- ggplot(ibm, aes(x = EnvironmentSatisfaction, fill = Attrition)) +
  geom_bar()+scale_fill_manual(values = c("#7EC0EE","#EEA2AD"))
grid.arrange(s1, s2, s3, ncol = 3, nrow = 1)- 从图中可以看出个人对公司内部各方面的满意度并不直接导致离职,离职率不随着满意度上升而降低,因此可以说明人们对IBM公司的满意度高低与是否离职无关
探索Attrition与JobInvolvement、JobLevel、JobRole的关系
w1 <- ggplot(ibm, aes(x = JobInvolvement, fill = Attrition)) +
  geom_bar()+scale_fill_manual(values = c("#7EC0EE","#EEA2AD"))+coord_flip()
w2 <- ggplot(ibm, aes(x = JobLevel, fill = Attrition)) +
  geom_bar()+scale_fill_manual(values = c("#7EC0EE","#EEA2AD"))+coord_flip()
levels(ibm$JobRole) <- c("HC", "HR", "LT", "Man", "MD", "RD", "RS", "SE", "SR")
w3 <- ggplot(ibm, aes(x = JobRole, fill = Attrition)) +
  geom_bar()+scale_fill_manual(values = c("#7EC0EE","#EEA2AD"))+coord_flip()
grid.arrange(w1, w2, w3, ncol = 1, nrow = 3)- 工作的参与度情况与离职率也没有相关关系
- 工作的层级越高离职数量越少,联系实际,导致这个的原因是(1)工作层架高的员工基数本身就小,所以离职人数相对来说也会较少(2)人们在一个公司工作很久已经升上管理层,那么换工作的想法会比较小,相反,底层员工则会不断寻找自己最适合的工作而不断的换岗位。
- 从图中可以看到,Sales Executive,Sales Representative,Laboratory Technician离职率较高,这些工作相对来说属于低层级的工作,而Manufacturing Director,Manager,Research Director离职率较低,这些部门主管、经理则是在公司待得比较久的,也和刚才分析的工作层级和离职率的关系相符合。
探索Attrition与BusinessTravel、Department、OverTime、TrainingTimesLastYear之间的关系
levels(ibm$BusinessTravel) <- c("R", "F", "N")
levels(ibm$Department) <- c("S", "RD", "HR")
a1 <- ggplot(ibm, aes(x = BusinessTravel, fill = Attrition)) +
  geom_bar()+scale_fill_manual(values = c("#7EC0EE","#EEA2AD"))+coord_flip()
a2 <- ggplot(ibm, aes(x = Department, fill = Attrition)) +
  geom_bar()+scale_fill_manual(values = c("#7EC0EE","#EEA2AD"))+coord_flip()
a3 <- ggplot(ibm, aes(x = OverTime, fill = Attrition)) +
  geom_bar()+scale_fill_manual(values = c("#7EC0EE","#EEA2AD"))
a4 <- ggplot(ibm, aes(x = TrainingTimesLastYear, fill = Attrition)) +
  geom_bar()+scale_fill_manual(values = c("#7EC0EE","#EEA2AD"))
grid.arrange(a1, a2, a3, a4, ncol = 2, nrow = 2)- 左上图中,出差次数越少,离职率越高
- 右上图中,RD部门离职人数较多,但是RD部门的总人数较多,所以也不能说明情况
- 左下图中,是否加班与离职情况有紧密关系,明显加班的人离职率较高
- 右下图中,去年在公司受培训的次数与离职率也没有明显关系
探索Attrition与PerformanceRating、StockOptionLevel、PercentSalaryHike之间的关系
ggplot(ibm,aes(PerformanceRating,StockOptionLevel,color=PercentSalaryHike))+
  geom_point(position = 'jitter')+
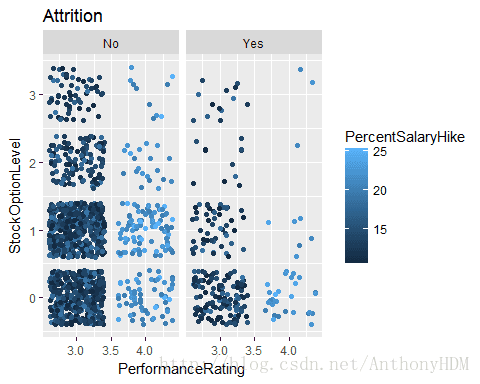
facet_wrap(~Attrition)+ggtitle("Attrition") - 从图中可以看出,离职率随StockOptionLevel增长而降低,随PerformanceRating越好而降低
探索MonthlyIncome、HourlyRate、DailyRate、MonthlyRate之间的关系
g1<-ggplot(ibm, aes(x  = MonthlyIncome, fill = Attrition,
    alpha = .7)) +geom_density()+scale_fill_manual(values = c("#7EC0EE","#EEA2AD"))
g2<-ggplot(ibm, aes(x  = HourlyRate, fill = Attrition,
    alpha = .7)) +geom_density()+scale_fill_manual(values = c("#7EC0EE","#EEA2AD"))
g3<-ggplot(ibm, aes(x  = DailyRate, fill = Attrition,
    alpha = .7)) +geom_density()+scale_fill_manual(values = c("#7EC0EE","#EEA2AD"))
g4<-ggplot(ibm, aes(x  = MonthlyRate, fill = Attrition,
    alpha = .7)) +geom_density()+scale_fill_manual(values = c("#7EC0EE","#EEA2AD"))
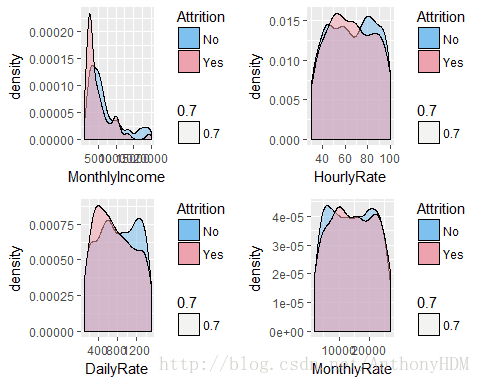
grid.arrange(g1, g2, g3, g4, ncol = 2, nrow = 2)- 从图中可以看出,大部分离开的人月收入和日率相对较低,小时费率和月利率则和离职率没有什么显而易见的关系。
RandomForest
加载需要的包
#install.packages('randomForest')
#install.packages('party')
#install.packages('rpart.plot')
#install.packages('rattle')
#install.packages('rpart')
library(randomForest)
library(party)
library(rpart.plot)
library(rattle)
library(rpart)
将样本分为80%训练数据,20%测试数据
set.seed(12345)
ibm<-ibm[c(-9,-10,-22,-27)]
ins<-sample(2,nrow(ibm),replace = TRUE,prob = c(0.8,0.2))
trainData<-ibm[ins==1,]
testData<-ibm[ins==2,]
建立随机森林模型
ibm.rf1<-randomForest(Attrition~.,trainData,ntree=500,nPerm=10,mtry=30,proximity=TRUE,importance=TRUE)
print(ibm.rf1)
##
## Call:
##  randomForest(formula = Attrition ~ ., data = trainData, ntree = 500,      nPerm = 10, mtry = 30, proximity = TRUE, importance = TRUE)
##                Type of random forest: classification
##                      Number of trees: 500
## No. of variables tried at each split: 30
##
##         OOB estimate of  error rate: 14.03%
## Confusion matrix:
##      No Yes class.error
## No  961  16  0.01637666
## Yes 147  38  0.79459459

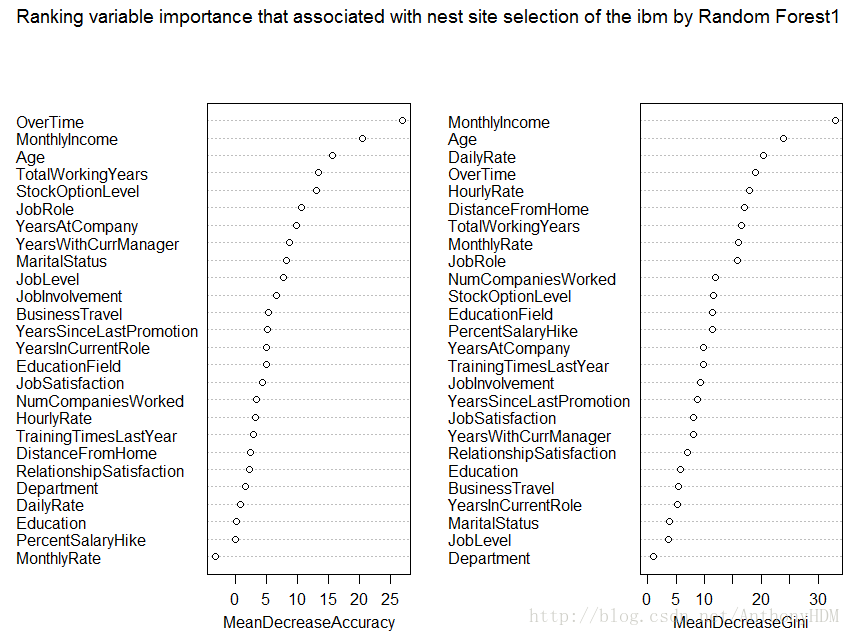
varImpPlot(ibm.rf1,main='Ranking variable importance that associated with nest site selection of the ibm by Random Forest1')
• 随机森林预测模型的误差率14.03%,模型需要进一步优化
画出决策树
dtree1 <- rpart(Attrition ~., data = trainData)
fancyRpartPlot(dtree1,cex=0.7)
print(dtree1)
## n= 1162
##
## node), split, n, loss, yval, (yprob)
##       * denotes terminal node
##
##   1) root 1162 185 No (0.84079174 0.15920826)
##     2) TotalWorkingYears>=1.5 1090 150 No (0.86238532 0.13761468)
##       4) OverTime=No 798  75 No (0.90601504 0.09398496) *
##       5) OverTime=Yes 292  75 No (0.74315068 0.25684932)
##        10) MonthlyIncome>=3924 206  33 No (0.83980583 0.16019417)
##          20) JobRole=HC,HR,LT,Man,MD,RD,RS,SR 140  12 No (0.91428571 0.08571429) *
##          21) JobRole=SE 66  21 No (0.68181818 0.31818182)
##            42) StockOptionLevel>=0.5 37   5 No (0.86486486 0.13513514) *
##            43) StockOptionLevel< 0.5 29  13 Yes (0.44827586 0.55172414)
##              86) WorkLifeBalance>=2.5 21   8 No (0.61904762 0.38095238)
##               172) YearsInCurrentRole< 6.5 13   2 No (0.84615385 0.15384615) *
##               173) YearsInCurrentRole>=6.5 8   2 Yes (0.25000000 0.75000000) *
##              87) WorkLifeBalance< 2.5 8   0 Yes (0.00000000 1.00000000) *
##        11) MonthlyIncome< 3924 86  42 No (0.51162791 0.48837209)
##          22) Age>=33.5 43  13 No (0.69767442 0.30232558)
##            44) BusinessTravel=N 34   7 No (0.79411765 0.20588235) *
##            45) BusinessTravel=R,F 9   3 Yes (0.33333333 0.66666667) *
##          23) Age< 33.5 43  14 Yes (0.32558140 0.67441860)
##            46) NumCompaniesWorked< 1.5 30  14 Yes (0.46666667 0.53333333)
##              92) JobRole=RS 19   7 No (0.63157895 0.36842105) *
##              93) JobRole=HR,LT,SR 11   2 Yes (0.18181818 0.81818182) *
##            47) NumCompaniesWorked>=1.5 13   0 Yes (0.00000000 1.00000000) *
##     3) TotalWorkingYears< 1.5 72  35 No (0.51388889 0.48611111)
##       6) Age>=33.5 10   0 No (1.00000000 0.00000000) *
##       7) Age< 33.5 62  27 Yes (0.43548387 0.56451613)
##        14) HourlyRate>=53 45  20 No (0.55555556 0.44444444)
##          28) MaritalStatus=Divorced 8   0 No (1.00000000 0.00000000) *
##          29) MaritalStatus=Married,Single 37  17 Yes (0.45945946 0.54054054)
##            58) OverTime=No 24   9 No (0.62500000 0.37500000) *
##            59) OverTime=Yes 13   2 Yes (0.15384615 0.84615385) *
##        15) HourlyRate< 53 17   2 Yes (0.11764706 0.88235294) *
在测试集上测试训练集上建立的随机森林
ibm.pre1<-predict(ibm.rf1,testDataprop.table(table(predictd=ibm.pre1,observed=ibm[ins==2,"Attrition"], dnn = c( "Predicted","Actual")),1)
##          Actual
## Predicted        No       Yes
##       No  0.8671329 0.1328671
##       Yes 0.3636364 0.6363636
• 结果中可以看到,预测的结果和实际差别有点大,需要进行模型优化
优化决策模型
ibm.rf2<-randomForest(ibm[,c('Age','BusinessTravel','EducationField','JobInvolvement','JobLevel','JobRole','JobSatisfaction','MonthlyIncome','NumCompaniesWorked','OverTime','StockOptionLevel','TotalWorkingYears','YearsAtCompany')],ibm[,'Attrition'],importance = TRUE,ntree=500)
print(ibm.rf2)
## Call:
##  randomForest(x = ibm[, c("Age", "BusinessTravel", "EducationField",      "JobInvolvement", "JobLevel", "JobRole", "JobSatisfaction",      "MonthlyIncome", "NumCompaniesWorked", "OverTime", "StockOptionLevel",      "TotalWorkingYears", "YearsAtCompany")], y = ibm[, "Attrition"],      ntree = 500, importance = TRUE)
##                Type of random forest: classification
##                      Number of trees: 500
## No. of variables tried at each split: 3
##
##         OOB estimate of  error rate: 13.88%
## Confusion matrix:
##       No Yes class.error
## No  1204  29  0.02351987
## Yes  175  62  0.73839662

varImpPlot(ibm.rf2,main='Ranking variable importance that associated with nest site selection of the ibm by Random Forest2')
• 随机森林预测模型优化后的的误差率13.88%,有微小降低,但是仍然很高,需要继续优化
dtree2 <- rpart(Attrition ~Age+BusinessTravel+EducationField+JobInvolvement+JobLevel+             JobRole+JobSatisfaction+MonthlyIncome+NumCompaniesWorked+OverTime+StockOptionLevel+TotalWorkingYears+YearsAtCompany, data = trainData)
fancyRpartPlot(dtree2,cex=0.7)
print(dtree2)
## n= 1162
##
## node), split, n, loss, yval, (yprob)
## * denotes terminal node
##
## 1) root 1162 185 No (0.84079174 0.15920826)
## 2) TotalWorkingYears>=1.5 1090 150 No (0.86238532 0.13761468)
## 4) OverTime=No 798 75 No (0.90601504 0.09398496) *
## 5) OverTime=Yes 292 75 No (0.74315068 0.25684932)
## 10) MonthlyIncome>=3924 206 33 No (0.83980583 0.16019417)
## 20) JobRole=HC,HR,LT,Man,MD,RD,RS,SR 140 12 No (0.91428571 0.08571429) *
## 21) JobRole=SE 66 21 No (0.68181818 0.31818182)
## 42) StockOptionLevel>=0.5 37 5 No (0.86486486 0.13513514) *
## 43) StockOptionLevel< 0.5 29 13 Yes (0.44827586 0.55172414)
## 86) MonthlyIncome< 7933 22 9 No (0.59090909 0.40909091)
## 172) NumCompaniesWorked< 2 14 4 No (0.71428571 0.28571429) *
## 173) NumCompaniesWorked>=2 8 3 Yes (0.37500000 0.62500000) *
## 87) MonthlyIncome>=7933 7 0 Yes (0.00000000 1.00000000) *
## 11) MonthlyIncome< 3924 86 42 No (0.51162791 0.48837209)
## 22) Age>=33.5 43 13 No (0.69767442 0.30232558)
## 44) BusinessTravel=N 34 7 No (0.79411765 0.20588235) *
## 45) BusinessTravel=R,F 9 3 Yes (0.33333333 0.66666667) *
## 23) Age< 33.5 43 14 Yes (0.32558140 0.67441860)
## 46) NumCompaniesWorked< 1.5 30 14 Yes (0.46666667 0.53333333)
## 92) JobRole=RS 19 7 No (0.63157895 0.36842105) *
## 93) JobRole=HR,LT,SR 11 2 Yes (0.18181818 0.81818182) *
## 47) NumCompaniesWorked>=1.5 13 0 Yes (0.00000000 1.00000000) *
## 3) TotalWorkingYears< 1.5 72 35 No (0.51388889 0.48611111)
## 6) Age>=33.5 10 0 No (1.00000000 0.00000000) *
## 7) Age< 33.5 62 27 Yes (0.43548387 0.56451613)
## 14) OverTime=No 40 17 No (0.57500000 0.42500000)
## 28) EducationField=LS,MED,Oth 32 10 No (0.68750000 0.31250000) *
## 29) EducationField=HR,MRK,TD 8 1 Yes (0.12500000 0.87500000) *
## 15) OverTime=Yes 22 4 Yes (0.18181818 0.81818182) *
Gradient Boosting Machines
加载需要的包
#install.packages('caret')
#install.packages('gbm')
#install.packages('ROCR')
#install.packages('pROC')
library(ROCR)
library(pROC)
library(gbm)
library(caret)
将响应变量转为0-1格式
data <- ibm[c(-9,-10,-22,-27)]
data$Attrition <- as.numeric(data$Attrition)
data <- transform(data,Attrition=Attrition-1)
建立模型并预测,求出auc值
model <- gbm(Attrition~.,data=data,shrinkage=0.01,            distribution='bernoulli',cv.folds=5,n.trees=3000,verbose=F)
gbm.predict = predict(model,data)
## Using 2188 trees...

auc(data$Attrition,gbm.predict)
## Area under the curve: 0.8848
- 可以看到模型预测的精确度达到88.48%
用交叉检验确定最佳迭代次数
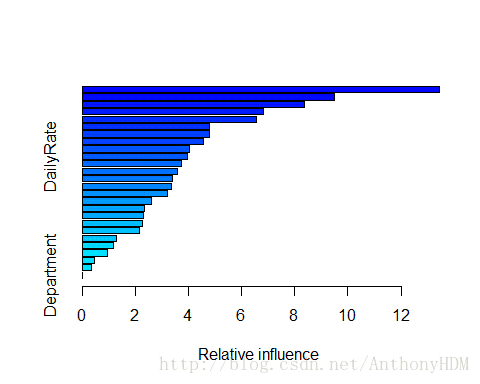
best.iter <- gbm.perf(model,method='cv')观察各变量的重要程度
summary(model,best.iter)
##                                               var    rel.inf
## OverTime                                 OverTime 13.4554665
## MonthlyIncome                       MonthlyIncome  9.4844019
## JobRole                                   JobRole  8.3738137
## Age                                           Age  6.8159676
## StockOptionLevel                 StockOptionLevel  6.5639248
## TotalWorkingYears               TotalWorkingYears  4.8031740
## NumCompaniesWorked             NumCompaniesWorked  4.7993857
## JobInvolvement                     JobInvolvement  4.5517174
## BusinessTravel                     BusinessTravel  4.0257955
## DailyRate                               DailyRate  3.9737030
## YearsWithCurrManager         YearsWithCurrManager  3.7192388
## DistanceFromHome                 DistanceFromHome  3.5723627
## JobSatisfaction                   JobSatisfaction  3.4075800
## EducationField                     EducationField  3.3547052
## YearsAtCompany                     YearsAtCompany  3.2044773
## RelationshipSatisfaction RelationshipSatisfaction  2.6068148
## JobLevel                                 JobLevel  2.3288474
## MonthlyRate                           MonthlyRate  2.3059917
## YearsSinceLastPromotion   YearsSinceLastPromotion  2.2537875
## TrainingTimesLastYear       TrainingTimesLastYear  2.1625711
## HourlyRate                             HourlyRate  1.2800840
## MaritalStatus                       MaritalStatus  1.1688000
## PercentSalaryHike               PercentSalaryHike  0.9610313
## Education                               Education  0.4673412
## YearsInCurrentRole             YearsInCurrentRole  0.3590171
## Department                             Department  0.0000000
综上所述,我们认为影响IBM公司员工离职最重要的5个因素是:OverTime、MonthlyIncome、JobRole、Age、StockOptionLevel.因此,我们建议IBM公司可以从以下几个方面进行优化改进从而留住员工:
(1)合理安排工作计划,减少加班频率;
(2)在公司能够财务状况允许的合理范围内尽量为员工增加工资,员工是公司最重要的财富,因此公司应该为留住员工而努力;
(3)职业的选择关乎员工的能力、兴趣等各个方面,这不是公司能够决定的,但是建议公司可以根据现有的离职率较高的职业,对其人员进行合理的关怀,以得打最好的效果;
(4)年龄也是影响人员流动率的一个主要因素,刚进公司的人员离职率较高,建议公司可以在两个方面进行提升:第一,HR方面应该重点关注,是否在招聘时没有找到最合适该岗位的人才,或者将人才用错了地方;第二,公司可以适当地为初进入公司的职员进行相应人文关怀,并配备导师为其进行指导,降低人员的流动率。
