SpringBoot整合Echarts完成图表显示
SpringBoot是我非常喜欢的一个后台框架,开发迅速便捷且功能强大。ECharts是一个免费的、功能强大的、可视化的一个库。它可以非常简单的往软件产品中添加直观的、动态的和高度可定制化的图表。它是一个全新的基于zrender的用纯JavaScript打造完成的canvas库。
之所以在这里将两者结合起来是因为要为日后的数据可视化的学习做准备。这两者的详细信息都可以去官网上了解一下官方文档。
快速构建springboot项目我就不说了,这里直接贴出我的核心代码和项目架构。详细代码请参考我的相应github仓库 https://github.com/29DCH/Real-time-log-analysis-system 欢迎star+fork!
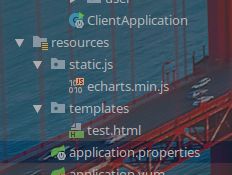
如上图所示,在资源目录文件夹下面的static/js和templates中分别添加和新建echarts.min.js和test.html文件,echarts.min.js文件可以去官网或者我的github仓库下载。
application.properties文件中可以配置你自己的项目访问路径和端口号。
pom.xml文件加上thymeleaf依赖(显示静态页面用的)
        <dependency>
            <groupId>org.springframework.bootgroupId>
            <artifactId>spring-boot-starter-thymeleafartifactId>
        dependency>
test.html
<html lang="en">
<head>
    <meta charset="UTF-8"/>
    <title>testtitle>


    <script src="js/echarts.min.js">script>
head>
<body>


<div id="main" style="width: 600px;height:400px;position: absolute; top:50%; left: 50%; margin-top: -200px;margin-left: -300px">div>


<script type="text/javascript">
    // 基于准备好的dom,初始化echarts实例
    var myChart = echarts.init(document.getElementById('main'));

    // 指定图表的配置项和数据
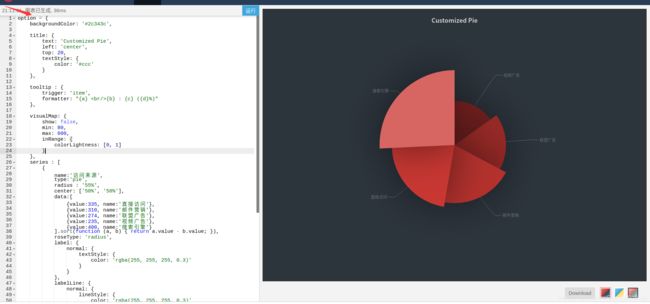
    option = {
    backgroundColor: '#2c343c',

    title: {
        text: 'Customized Pie',
        left: 'center',
        top: 20,
        textStyle: {
            color: '#ccc'
        }
    },

    tooltip : {
        trigger: 'item',
        formatter: "{a}
{b} : {c} ({d}%)"
    },

    visualMap: {
        show: false,
        min: 80,
        max: 600,
        inRange: {
            colorLightness: [0, 1]
        }
    },
    series : [
        {
            name:'访问来源',
            type:'pie',
            radius : '55%',
            center: ['50%', '50%'],
            data:[
                {value:335, name:'直接访问'},
                {value:310, name:'邮件营销'},
                {value:274, name:'联盟广告'},
                {value:235, name:'视频广告'},
                {value:400, name:'搜索引擎'}
            ].sort(function (a, b) { return a.value - b.value; }),
            roseType: 'radius',
            label: {
                normal: {
                    textStyle: {
                        color: 'rgba(255, 255, 255, 0.3)'
                    }
                }
            },
            labelLine: {
                normal: {
                    lineStyle: {
                        color: 'rgba(255, 255, 255, 0.3)'
                    },
                    smooth: 0.2,
                    length: 10,
                    length2: 20
                }
            },
            itemStyle: {
                normal: {
                    color: '#c23531',
                    shadowBlur: 200,
                    shadowColor: 'rgba(0, 0, 0, 0.5)'
                }
            },

            animationType: 'scale',
            animationEasing: 'elasticOut',
            animationDelay: function (idx) {
                return Math.random() * 200;
            }
        }
    ]
};

    // 使用刚指定的配置项和数据显示图表。
    myChart.setOption(option);
script>
body>
html>
注意这一段代码
// 指定图表的配置项和数据
   option = {
    backgroundColor: '#2c343c',

    title: {
        text: 'Customized Pie',
        left: 'center',
        top: 20,
        textStyle: {
            color: '#ccc'
        }
    },

    tooltip : {
        trigger: 'item',
        formatter: "{a} <br/>{b} : {c} ({d}%)"
    },

    visualMap: {
        show: false,
        min: 80,
        max: 600,
        inRange: {
            colorLightness: [0, 1]
        }
    },
    series : [
        {
            name:'访问来源',
            type:'pie',
            radius : '55%',
            center: ['50%', '50%'],
            data:[
                {value:335, name:'直接访问'},
                {value:310, name:'邮件营销'},
                {value:274, name:'联盟广告'},
                {value:235, name:'视频广告'},
                {value:400, name:'搜索引擎'}
            ].sort(function (a, b) { return a.value - b.value; }),
            roseType: 'radius',
            label: {
                normal: {
                    textStyle: {
                        color: 'rgba(255, 255, 255, 0.3)'
                    }
                }
            },
            labelLine: {
                normal: {
                    lineStyle: {
                        color: 'rgba(255, 255, 255, 0.3)'
                    },
                    smooth: 0.2,
                    length: 10,
                    length2: 20
                }
            },
            itemStyle: {
                normal: {
                    color: '#c23531',
                    shadowBlur: 200,
                    shadowColor: 'rgba(0, 0, 0, 0.5)'
                }
            },

            animationType: 'scale',
            animationEasing: 'elasticOut',
            animationDelay: function (idx) {
                return Math.random() * 200;
            }
        }
    ]
};
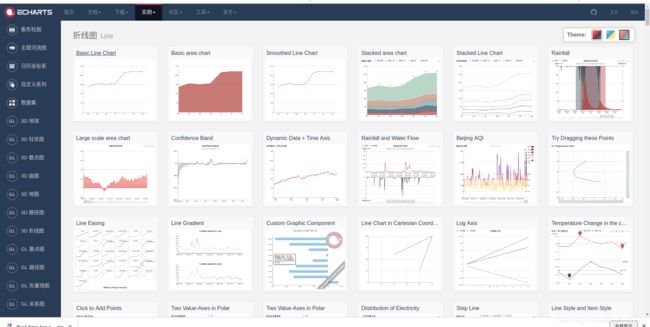
可以替换成其他模板,详情见官网中的实例 http://echarts.baidu.com/examples/
HelloSpringBoot.java
package Test;

import org.springframework.web.bind.annotation.RequestMapping;
import org.springframework.web.bind.annotation.RequestMethod;
import org.springframework.web.bind.annotation.RestController;
import org.springframework.web.servlet.ModelAndView;

@RestController
public class HelloSpringBoot {

    @RequestMapping(value = "/example", method = RequestMethod.GET)
    public ModelAndView firstDemo() {
        return new ModelAndView("test");
    }
}
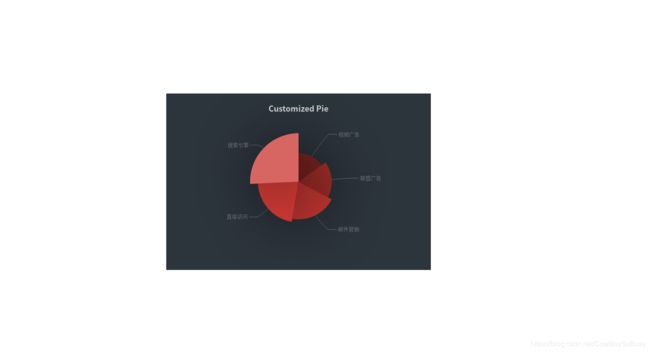
运行springboot项目,输入指定好的访问路径,这里我是http://localhost:8081/tc/example
我这边的代码(只是部分,详情见上面说过的我的github仓库)以及一些端口、路径可能和上传到我github仓库中的有不一样的地方,你们下好以后照着自己的情况修改好就能运行。不一定要完全照我的来,我这里只是给出了全部的思路和流程而已。
上面说了可以有更多的效果,去官网复制样例的代码替换test.html中option部分即可达到你想要的效果。
注意这里的例子中数据都是固定死了的(静态的),当然我这里只是给你们举个例子。到后面的实际项目中可以用后端提供的数据接口把指定数据传入文件指定位置对接好即可,就能达到将数据库中的数据可视化显示出来的效果。
这里只是Echarts的小部分内容,随着后面项目(数据可视化)、学习的进一步深入,将持续完善Echarts的介绍
