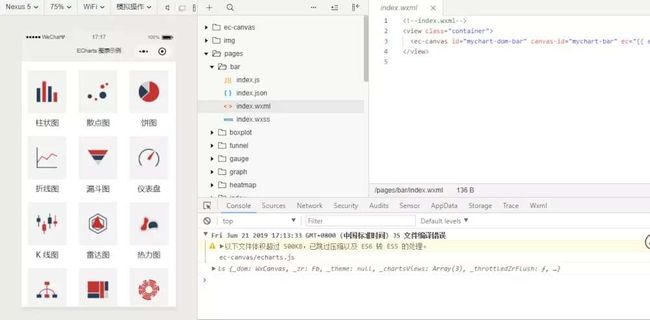
1:下载 GitHub 上的 项目
2:但项目下载之后,打开小程序开发工具,可以看到效果如下,适配性还是比较完美的。
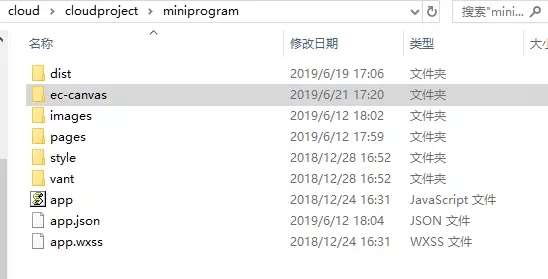
如果是在项目里面引入组件的话,打开从github上面下载的代码,将ec-canvas文件夹复制黏贴到你的项目里面。
好的,组件已经复制到了我的项目里面,现在我想实现一个折线图,现在开始去组件里面搬运复制黏贴代码了。
wxml
js
import * as echarts from '../../ec-canvas/echarts';
const app = getApp();
function initChart(canvas, width, height) {
const chart = echarts.init(canvas, null, {
width: width,
height: height
});
canvas.setChart(chart);
var option = {
title: {
text: '测试下面legend的红色区域不应被裁剪',
left: 'center'
},
color: ["#37A2DA", "#67E0E3", "#9FE6B8"],
legend: {
data: ['A', 'B', 'C'],
top: 50,
left: 'center',
backgroundColor: 'red',
z: 100
},
grid: {
containLabel: true
},
tooltip: {
show: true,
trigger: 'axis'
},
xAxis: {
type: 'category',
boundaryGap: false,
data: ['周一', '周二', '周三', '周四', '周五', '周六', '周日'],
// show: false
},
yAxis: {
x: 'center',
type: 'value',
splitLine: {
lineStyle: {
type: 'dashed'
}
}
// show: false
},
series: [{
name: 'A',
type: 'line',
smooth: true,
data: [18, 36, 65, 30, 78, 40, 33]
}, {
name: 'B',
type: 'line',
smooth: true,
data: [12, 50, 51, 35, 70, 30, 20]
}, {
name: 'C',
type: 'line',
smooth: true,
data: [10, 30, 31, 50, 40, 20, 10]
}]
};
chart.setOption(option);
return chart;
}
Page({
onShareAppMessage: function (res) {
return {
title: 'ECharts 可以在微信小程序中使用啦!',
path: '/pages/index/index',
success: function () { },
fail: function () { }
}
},
data: {
ec: {
onInit: initChart
}
},
onReady() {
}
});
json
{
"usingComponents": {
"ec-canvas": "../../ec-canvas/ec-canvas"
}
}
css
/**index.wxss**/
ec-canvas {
width: 100%;
height: 100%;
}
这一步为止,代码搬运结束,刷新按钮,但是,为什么界面显示空白?没有报错,代码也一模一样,真实让人费解,算了,还是先放在这里吧,吃饭要紧。
.......
.......
继续写
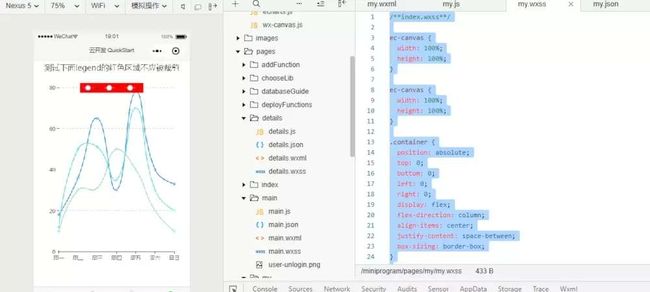
对,没错,空白不显示的原因出在了css文件上面,只要我们在css里面再写上一些代码之后。
/**index.wxss**/
ec-canvas {
width: 100%;
height: 100%;
}
ec-canvas {
width: 100%;
height: 100%;
}
.container {
position: absolute;
top: 0;
bottom: 0;
left: 0;
right: 0;
display: flex;
flex-direction: column;
align-items: center;
justify-content: space-between;
box-sizing: border-box;
}
.picker-pos {
margin-top: -130rpx;
margin-left: 150rpx;
color: blueviolet;
}
这个时候
小程序Echarts图表组件算是已经可以运用在项目里面啦
以上就是本文的全部内容,希望对大家的学习有所帮助,也希望大家多多支持脚本之家。


