【机器学习】使用Scikit-Learn库实现决策树
决策树算法:。从树根来说,基于可获得的最大信息增益的特征来对数据进行划分通过迭代处理,在每个子节点上重复此划分过程,直到叶子结点。
剪通过枝来限定树的最大深度。
最大信息增益:
˚F为要划分的特征,DP与了Dj分别为父节点和第Ĵ个子节点,我为不纯度衡量标准,NP为父节点中的样本数量,新泽西州为第Ĵ个子节点中的样本数量。
信息增益:父节点的不纯度与所有子节点不纯度总和之差,子节点的不纯度越低,信息增益越大
大多数库,如SKlearn中都实现了二叉决策树,每个父节点被分为两个子节点:去离子和博士
二叉决策树常用的三个不纯度衡量标准或划分标准为:基尼系数(IG),熵(1H),误分类率(IE)。
熵,使得互信息最大化:
基尼系数,降低误分类可能性的标准,与熵生成相似结果:
误分类率:
![]()
本文使用的数据集和库文件定义在该章节有定义了,链接:http://mp.blog.csdn.net/postedit/79196206
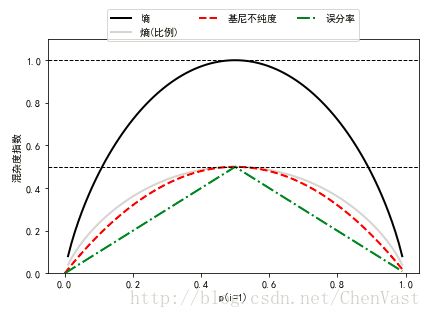
生成三种方法比较图:
# 基尼系数
def gini(p):
    return (p) * (1 - (p)) + (1 - p) * (1 - (1 - p))

# 熵
def entropy(p):
    return - p * np.log2 (p) - (1 - p) * np.log2 ((1 - p))

# 误差
def error(p):
    return 1 - np.max ([p, 1 - p])

def PlotHEE():
    x = np.arange (0.0, 1.0, 0.01)

    ent = [entropy (p) if p != 0 else None for p in x]
    sc_ent = [e * 0.5 if e else None for e in ent]
    err = [error (i) for i in x]

    fig = plt.figure ()
    ax = plt.subplot (111)
    for i, lab, ls, c, in zip ([ent, sc_ent, gini (x), err],
                               ['熵', '熵(比例)',
                                '基尼不纯度', '误分率'],
                               ['-', '-', '--', '-.'],
                               ['black', 'lightgray', 'red', 'green', 'cyan']):
        line = ax.plot (x, i, label=lab, linestyle=ls, lw=2, color=c)

    ax.legend (loc='upper center', bbox_to_anchor=(0.5, 1.15),
               ncol=3, fancybox=True, shadow=False)

    ax.axhline (y=0.5, linewidth=1, color='k', linestyle='--')
    ax.axhline (y=1.0, linewidth=1, color='k', linestyle='--')
    plt.ylim ([0, 1.1])
    plt.xlabel ('p(i=1)')
    plt.ylabel ('混杂度指数')
    plt.tight_layout ()
    # plt.savefig ('./figures/impurity.png', dpi=300, bbox_inches='tight')
    plt.show ()

# PlotHEE()
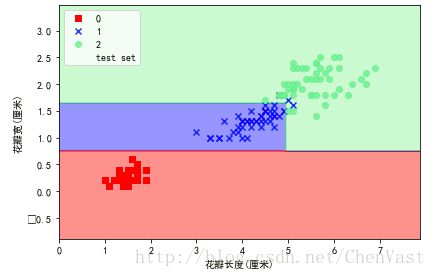
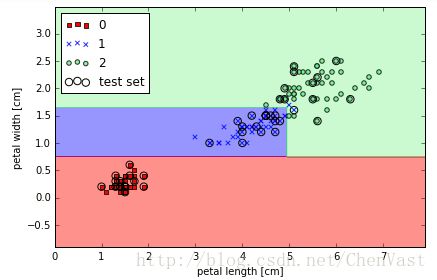
构建决策树:
def DecisionTrees():
    tree = DecisionTreeClassifier (criterion='entropy', max_depth=3, random_state=0)
    tree.fit (X_train, y_train)

    X_combined = np.vstack ((X_train, X_test))
    y_combined = np.hstack ((y_train, y_test))
    plot_decision_regions (X_combined, y_combined,
                           classifier=tree, test_idx=range (105, 150))

    plt.xlabel ('花瓣长度(厘米)')
    plt.ylabel ('花瓣宽(厘米)')
    plt.legend (loc='upper left')
    plt.tight_layout ()
    # plt.savefig('./figures/decision_tree_decision.png', dpi=300)
    plt.show ()

DecisionTrees()


