机械学习与R语言---决策树算法的实现与优化(Decision tree algorithm)
本篇需要使用的数据集为credit.csv,下载好并保存于R目录。
1.理解决策树算法
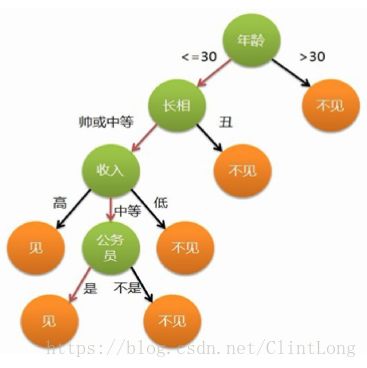
简而言之,决策树是一个分类器(classifier)。 它利用树状结构,来对于特征以及潜在的结果之间的关系建立模型。如下图(来源网络):
在决定是见于不见的时候,决策树给出了一些节点(node)来作为判断依据,至于这些节点是如何被找到的,内在的算法是什么,这个很难在这里讲清楚(而且严格地讲,我们每个人都可以不依赖R中已有的function而自己去编写决策树函数(并不会很难,如果你的逻辑简单的话)),但是决策树算法合适停下来却很容易理解:
a. 没有剩余的特征来分辨案例之间的区别
b.决策树已经达到预先定义的大小限制
2.此次的目的
credit.csv file里包含着的是1000个关于贷款的案例,我们的目的是希望建立模型来预测影响违约风险的因素。 数据里面的变量很多,最关键的是最后一个default变量,Yes便是违约了,No便是没有违约。
正如很多在R中的函数一样,决策树函数在R中也不仅仅是一个表达式,这里介绍一个较为常见的包和function,C5.0算法。
这个算法的内在逻辑可以自行上网查阅(切记,没有任何一种算法是绝对好的,我们并不需要找出什么时候哪个算法更好,也没必要,只需要这个算法拟合度高便行)
install.packages( 'C50' )

library( C50 )  #安装c50包
读取我们已经下载好的csv文件:
credit <- read.csv("credit.csv") 往往我们需要设置stringAsFactors= F 来使字符型数据不被设为因子(factor),我们可以先设置,然后再更具自己的需要一个个调整,但是这里我并没有设置,因为我需要将他们设置为factor。
3.准备工作-data clean
如果你多次尝试过自己完完整整的处理一个项目(数据由别人提供),你会发现,data cleaning将会占用你整个项目8成以上的时间,你需要不断地去清洗数据以达到你需要的最终结果,甚至很多时候结果不好仅仅是因为数据的清洗不到位。
dim(credit)
head(credit)
tail(credit)
str(credit)
summary(credit)
which(!complete.cases(credit))
有一些步骤我们经常都要做,比如了解数据整体结构,看一看有没有缺失值,即使C5.0 的decision tree算法可以帮助我们处理缺失值,但是你仍然得去看看有没有缺失值,这有助于你了解数据的整体性。
> table(credit$default)

 no yes
700 300
整体而言,违约的人数是30%,所以在之后我们随机分类training data 和testing data的时候, 这个大概的比例我们也应该记在心中,如果比例差距很大,建议再做一次随机分类。
进行数据分类:
set.seed(123)   #这一步是为了使你的结果和我的一样
train_sample <- sample(1000, 900)

str(train_sample)

# split the data frames
credit_train <- credit[train_sample, ]  #训练组
credit_test  <- credit[-train_sample, ]  #测试组

prop.table(table(credit_train$default))

       no       yes
0.7033333 0.2966667
prop.table(table(credit_test$default))

  no  yes
0.67 0.33
我使用了set.seed(123)来建立伪随机,因为如果没有这个codes的话,你跑出来的结果肯定和我的不一样,因为下一步的sample是完全随机的。 尽管的伪随机,但是和真正的随机机制没有什么区别。
可以看见,No的比例在70%左右, yes的比例也在30%左右,总体符合我们数据特点。
4.使用C5.0函数建立模型
之前我们已经安装了C50包,而里面的决策树模型函数是C5.0
credit_model <- C5.0(x= credit_train[-17], y= credit_train$default) #x为training data,去除
#17th column因为那是 我们需要的结果, y为class,必须是一个levels大于2的因子变量

> credit_model

Call:
C5.0.default(x = credit_train[-17], y = credit_train$default)

Classification Tree
Number of samples: 900   #900个samples
Number of predictors: 16 #使用了16个预测量(我们数据里面一共有17列,除去被我们去除的17列,就是说
#这里使用了全部变量,过拟合!!!)

Tree size: 57    #树的node有57个,也就是说57个分叉口

Non-standard options: attempt to group attributes
值得注意的是,这里使用了数据里面全部的列(16个)作为predictors,这也是决策树缺点之一:过拟合。 后续的博客会提到的随机森林理论可以很好的解决这一点。
> summary(credit_model)

Call:
C5.0.default(x = credit_train[-17], y = credit_train$default)


C5.0 [Release 2.07 GPL Edition]  	Tue Jul 17 17:15:45 2018
-------------------------------

Class specified by attribute `outcome'

Read 900 cases (17 attributes) from undefined.data

Decision tree:

checking_balance in {> 200 DM,unknown}: no (412/50)
checking_balance in {< 0 DM,1 - 200 DM}:
:...credit_history in {perfect,very good}: yes (59/18)
    credit_history in {critical,good,poor}:
    :...months_loan_duration <= 22:
        :...credit_history = critical: no (72/14)
        :   credit_history = poor:
        :   :...dependents > 1: no (5)
        :   :   dependents <= 1:
        :   :   :...years_at_residence <= 3: yes (4/1)
        :   :       years_at_residence > 3: no (5/1)
这是决策树结果的一部分,告诉了我们nodes是如何被分类的。 如第一行:checking_balance in {> 200 DM,unknown}: no (412/50), 告诉我们支票账户如果大于200 DM 或者unknown的时候, 那么我们判断为不大可能违约,(412/50)表示412个案例符合这个判断, 50个案例违背了判断。你会发现这个判断似乎没有逻辑可言,>200可以理解为有存款,违约当然概率低。但是unknown却让人难以理解,这有可能是因为异常值导致的,又或者是这便是真实情况(也许unknown的人存款都很大,或者是某个地区统计的时候漏掉了,但是该地区属于富裕地区)。
5.评估模型
> # create a factor vector of predictions on test data
> credit_pred <- predict(credit_model, credit_test)
> # cross tabulation of predicted versus actual classes
> library(gmodels)
> CrossTable(credit_test$default, credit_pred,
+            prop.chisq = FALSE,  prop.c = FALSE,
+            dnn = c('actual default', 'predicted default'))


   Cell Contents
|-------------------------|
|                       N |
|           N / Row Total |
|         N / Table Total |
|-------------------------|


Total Observations in Table:  100


               | predicted default
actual default |        no |       yes | Row Total |
---------------|-----------|-----------|-----------|
            no |        59 |         8 |        67 |
               |     0.881 |     0.119 |     0.670 |
               |     0.590 |     0.080 |           |
---------------|-----------|-----------|-----------|
           yes |        19 |        14 |        33 |
               |     0.576 |     0.424 |     0.330 |
               |     0.190 |     0.140 |           |
---------------|-----------|-----------|-----------|
  Column Total |        78 |        22 |       100 |
---------------|-----------|-----------|-----------|
从结果而言,我们成功预测了100个测试案例中的73个,错误的预测中有8个守信案例(NO)被归为违约(YES),这是False possitive, 有19个 False negative的案例。 我们的结果看似有73%的正确率(不算糟糕),但是你如果把每一个结果都预测为NO的话,你也会有67%的正确率(和我们的就差7%),对比于我们的工作量而言,我们的预测可谓是毫无意义。更糟糕的是,我们的False negative预测有19个, 占整体违约数量(33个)的 58%,这是非常糟糕的,是不能接受的。试想错误地高估了一个人的守信度会给银行带来多大的损失。
6. 提升模型性能
这里就可以提到C5.0 函数中的另一个argument:trails(an integer specifying the number of boosting iterations. A value of one indicates that a single model is used.) 这是一个基于boosting的算法,正如R里面的描述,这是一种算法的集合,迭代。 默认值为1,意味着我们只使用一种算法。 通常我们将trails设为10,这已经通过实践检验可以提高精确度大概25%。
> credit_boost10 <- C5.0(credit_train[-17], credit_train$default,
+                        trials = 10)
> credit_boost10

Call:
C5.0.default(x = credit_train[-17], y = credit_train$default, trials
 = 10)

Classification Tree
Number of samples: 900
Number of predictors: 16

Number of boosting iterations: 10
Average tree size: 47.5

Non-standard options: attempt to group attributes
可以看见 average tree size变成了47.5,我们之前是57.而运行:
summary(credit_boost10)

Evaluation on training data (900 cases):

Trial	    Decision Tree
-----	  ----------------
	  Size      Errors

   0	    56  133(14.8%)
   1	    34  211(23.4%)
   2	    39  201(22.3%)
   3	    47  179(19.9%)
   4	    46  174(19.3%)
   5	    50  197(21.9%)
   6	    55  187(20.8%)
   7	    50  190(21.1%)
   8	    51  192(21.3%)
   9	    47  169(18.8%)
boost	         34( 3.8%)   <<


	   (a)   (b)    <-classified as
	  ----  ----
	   629     4    (a): class no
	    30   237    (b): class yes

> credit_boost_pred10 <- predict(credit_boost10, credit_test)
> CrossTable(credit_test$default, credit_boost_pred10,
+            prop.chisq = FALSE, prop.c = FALSE, prop.r = FALSE,
+            dnn = c('actual default', 'predicted default'))


   Cell Contents
|-------------------------|
|                       N |
|         N / Table Total |
|-------------------------|


Total Observations in Table:  100


               | predicted default
actual default |        no |       yes | Row Total |
---------------|-----------|-----------|-----------|
            no |        62 |         5 |        67 |
               |     0.620 |     0.050 |           |
---------------|-----------|-----------|-----------|
           yes |        13 |        20 |        33 |
               |     0.130 |     0.200 |           |
---------------|-----------|-----------|-----------|
  Column Total |        75 |        25 |       100 |
---------------|-----------|-----------|-----------|
可以发现错误率变成了 18%, False Negative 和false possitive 的预测都降低了。
但是这就足够了吗?
尽管在预测不会违约的案例上表现的很好,但是也将本来会违约的人预测为了不会违约(13/33)39%的错误率,这里表现的并不满意。幸运的是,如果我们认为False negative是不能接受的,因为这很可能会导致银行大量的损失,那么我们有办法在C5.0上增加一个argument来达到这一个目的:
> # create dimensions for a cost matrix
> matrix_dimensions <- list(c("no", "yes"), c("no", "yes"))
> names(matrix_dimensions) <- c("predicted", "actual")
> matrix_dimensions
$`predicted`
[1] "no"  "yes"

$actual
[1] "no"  "yes"

> # build the matrix
> error_cost <- matrix(c(0, 1, 4, 0), nrow = 2, dimnames = matrix_dimensions)
> error_cost
         actual
predicted no yes
      no   0   4
      yes  1   0
以上建立了一个matrix,这是因为C5.0里面的参数costs必须等于一个matrix(a matrix of costs associated with the possible errors. The matrix should have C columns and rows where C is the number of class levels.),这里将false negative的代价设为了4, false possitive设为1(值可以根据需求来调整)
> # apply the cost matrix to the tree
> credit_cost <- C5.0(credit_train[-17], credit_train$default,
+                     costs = error_cost)
> credit_cost_pred <- predict(credit_cost, credit_test)
> CrossTable(credit_test$default, credit_cost_pred,
+            prop.chisq = FALSE, prop.c = FALSE, prop.r = FALSE,
+            dnn = c('actual default', 'predicted default'))


   Cell Contents
|-------------------------|
|                       N |
|         N / Table Total |
|-------------------------|


Total Observations in Table:  100


               | predicted default
actual default |        no |       yes | Row Total |
---------------|-----------|-----------|-----------|
            no |        37 |        30 |        67 |
               |     0.370 |     0.300 |           |
---------------|-----------|-----------|-----------|
           yes |         7 |        26 |        33 |
               |     0.070 |     0.260 |           |
---------------|-----------|-----------|-----------|
  Column Total |        44 |        56 |       100 |
---------------|-----------|-----------|-----------|
看见整体错误率在 37%,并没有提高(反而下降了),但是false negative的预测却降到了7个(你可以尝试不断改变代价值来达到你想要的结果),如果你觉得这个错误率是可以接受的,那么这个模型本身便可以被接受了。
ALL IN ALL
我们最终的预测存在一些不尽如人意的地方,如错误率仍然偏高, false negative的值还是太多等等,这真的印证了人心不可预测,或者是贷款人的一些其他重要信息没有被搜集(如借款的目的)。没有完美的模型,也没有百分百的预测,但是总体上讲,决策树模型只要满足了我们的需求,那么就是可以接受的(也许false negative的值足够低就行,因为银行不希望亏本)
