React+antd+echarts实现前端数据显示
前端小学生一枚,代码技术水平不高,望大佬们指正,笔芯!
注:项目基于react官网提供的官方脚手架。
npm必需包
-
搭建官方脚手架
react官网链接:React
npm install create-react-app -g // 全局安装create-react-app,如果很慢,可以使用cnpm create-react-app my-app // my-app是项目名 cd my-app npm start // 启动项目 -
安装路由
npm install react-router-dom --save -
安装antd组件库
antd官网链接:Ant Design
npm install antd --save -
安装echarts
echarts官网链接:ECharts
npm install echarts --save
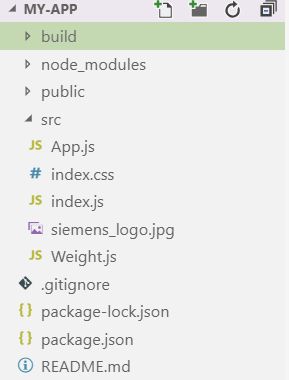
程序目录
程序代码
index.js
import React from 'react';
import ReactDOM from 'react-dom';
import {BrowserRouter as Router,Route,Link} from 'react-router-dom'
import { Layout, Menu, Icon } from 'antd';
import "antd/dist/antd.css";
import './index.css'
import App from './App';
import Wgh from './Weight';

const { Content, Sider } = Layout;

class Page extends React.Component {
    state = {
      collapsed: false,
    };
    onCollapse = (collapsed) => {
      this.setState({ collapsed });
    }
    render() {
      return (
        <Layout id="con">
            <Sider
                collapsible
                collapsed={this.state.collapsed}
                onCollapse={this.onCollapse}
            >
                {/* logo随着导航栏改变 */}
                {this.state.collapsed? <img src={require('./siemens_logo.jpg')} width="40px" id="logo" alt=""/>:<img src={require('./siemens_logo.jpg')} width="130px" id="logo" alt=""/>}
                <Menu theme="dark" mode="inline" defaultSelectedKeys={['1']}>
                    <Menu.Item key="1" >
                        <Link to="/">
                            <Icon type="line-chart" />
                            <span className="nav-text">数据</span>
                        </Link>
                    </Menu.Item>
                    <Menu.Item key="2" >
                        <Link to="/Weight">
                            <Icon type="line-chart" />
                            <span className="nav-text">称重</span>
                        </Link>
                    </Menu.Item>
                </Menu>
            </Sider>
            <Content style={{ margin: '24px 16px 24px ' }}>
                <div id="contain" style={{ padding: 24, background: '#fff'}}>
                    <Route exact path='/' component={App}/>
                    <Route path='/Weight' component={Wgh}/>
                </div>
            </Content>
        </Layout>
      );
    }
  }

ReactDOM.render(
    <Router>
        <Page/>
    </Router>
    , document.getElementById('root'));
index.css
#con{
    height: 100%;
    width: 100%;
    position: absolute;
    top: 0px;
    bottom: 0px;
}
#logo{
    margin-top:20px;
    margin-left:20px;
}
#contain{
    min-height:750;
    width: 100%;
    top: 24px;
    bottom: 24px;
}
App.js:数据
//数据图
import React from 'react';
// 引入 ECharts 主模块
import echarts from 'echarts/lib/echarts';
// 引入柱状图
import  'echarts/lib/chart/line';
// 引入提示框和标题组件
import 'echarts/lib/component/tooltip';
import 'echarts/lib/component/legend';
import 'echarts/lib/component/title';

export default class App extends React.Component {
    //清除上个页面定时器
    componentWillUnmount() {
        clearInterval(this.appInterval);
    }
    //获取数据,生命周期函数激活
    componentDidMount() {
        //数据初始化
        var TimeStamp,Ch1Val,Ch2Val,Ch3Val,Ch4Val,DAVal,ExVal;
        var data1=[];
        var data2=[];
        var data3=[];
        var data4=[];
        var data5=[];
        var data6=[];
        var data7=[];
        var myDisplay = echarts.init(document.getElementById('display'));
        //获取历史值
        fetch('/testReceiveInfoHis')
        .then((res) => { return res.json() })
        .then(data => {
            this.setState({historydata:data});
            data1=this.state.historydata.TimeStamp;
            data2=this.state.historydata.Ch1Val;
            data3=this.state.historydata.Ch2Val;
            data4=this.state.historydata.Ch3Val;
            data5=this.state.historydata.Ch4Val;
            data6=this.state.historydata.DAVal;
            data7=this.state.historydata.ExVal;
        })
        //1秒更新一次数据
        this.appInterval=setInterval(()=>{
            //var myDisplay = echarts.init(document.getElementById('display'));
            myDisplay.setOption({
                title: { text: '数据显示' },
                tooltip: {},
                legend: {
                    data:['Ch1Val','Ch2Val','Ch3Val','Ch4Val','DAVal','ExVal']
                },
                xAxis: [
                    {
                        type: 'category',
                        data:data1,
                        splitLine: {
                            show: false
                        }
                    }
                ],
                yAxis: [
                    {
                        type: 'value',
                        name : '                  简单数据显示',
                        boundaryGap: [0, '100%'],
                        splitLine: {
                            show: false
                        }
                    }
                ],
                series: [
                    {
                        name:'Ch1Val',
                        type: 'line',
                        data: data2
                    },
                    {
                        name:'Ch2Val',
                        type: 'line',
                        data: data3
                    },
                    {
                        name:'Ch3Val',
                        type: 'line',
                        data: data4
                    },
                    {
                        name:'Ch4Val',
                        type: 'line',
                        data: data5
                    },
                    {
                        name:'DAVal',
                        type: 'line',
                        data: data6
                    },
                    {
                        name:'ExVal',
                        type: 'line',
                        data: data7
                    }
                ]
            });
            //charts suits the screen
            window.onresize = function(){
                myDisplay.resize();
            };
            fetch('/testReceiveInfo')
            .then((res) => { return res.json() })
            .then(data => {
                this.setState({updatedata:data});
                TimeStamp=this.state.updatedata.TimeStamp;
                Ch1Val=this.state.updatedata.Ch1Val;
                Ch2Val=this.state.updatedata.Ch2Val;
                Ch3Val=this.state.updatedata.Ch3Val;
                Ch4Val=this.state.updatedata.Ch4Val;
                DAVal=this.state.updatedata.DAVal;
                ExVal=this.state.updatedata.ExVal;
                data1.shift();
                data1.push(TimeStamp);
                data2.shift();
                data2.push(Ch1Val);
                data3.shift();
                data3.push(Ch2Val);
                data4.shift();
                data4.push(Ch3Val);
                data5.shift();
                data5.push(Ch4Val);
                data6.shift();
                data6.push(DAVal);
                data7.shift();
                data7.push(ExVal);
            })
        },1000);
    }
    render() {
        return (
            <div id="display" style={{
               // width: 700,
                 height: 400 }}>
            </div>
        )
    }
}
Weight.js:称重
//传感器数据图
import React from 'react';
import {Row,Col} from 'antd';
import "antd/dist/antd.css";
// 引入 ECharts 主模块
import echarts from 'echarts/lib/echarts';
// 引入柱状图
import 'echarts/lib/chart/line';
// 引入提示框和标题组件
import 'echarts/lib/component/tooltip';
import 'echarts/lib/component/legend';
import 'echarts/lib/component/title';
export default class Wgh extends React.Component {
//清除上个页面定时器
componentWillUnmount() {
clearInterval(this.wghInterval);
}
//获取数据,生命周期函数激活
componentDidMount() {
//数据初始化
var time,W,WP,W1,W2,W3,W4,WP1,WP2,WP3,WP4;
var data1=[0,0,0,0,0,0,0,0,0,0];//time
var data2=[0,0,0,0,0,0,0,0,0,0];//W
var data3=[0,0,0,0,0,0,0,0,0,0];//WP
var data4=[0,0,0,0,0,0,0,0,0,0];//W1
var data5=[0,0,0,0,0,0,0,0,0,0];//W2
var data6=[0,0,0,0,0,0,0,0,0,0];//W3
var data7=[0,0,0,0,0,0,0,0,0,0];//W4
var data8=[0,0,0,0,0,0,0,0,0,0];//WP1
var data9=[0,0,0,0,0,0,0,0,0,0];//WP2
var data10=[0,0,0,0,0,0,0,0,0,0];//WP3
var data11=[0,0,0,0,0,0,0,0,0,0];//WP4
var myWeightTag1 = echarts.init(document.getElementById('main1'));
var myWeightTag2 = echarts.init(document.getElementById('main2'));
var myWeightTag3 = echarts.init(document.getElementById('main3'));
var myWeightTag4 = echarts.init(document.getElementById('main4'));
var myWeightTag5 = echarts.init(document.getElementById('main5'));
//获取历史值
fetch('/testHistory')
.then((res) => { return res.json() })
.then(data => {
this.setState({historydata:data});
data1=this.state.historydata.time;
data2=this.state.historydata.W;
data3=this.state.historydata.WP;
data4=this.state.historydata.W1;
data5=this.state.historydata.W2;
data6=this.state.historydata.W3;
data7=this.state.historydata.W4;
data8=this.state.historydata.WP1;
data9=this.state.historydata.WP2;
data10=this.state.historydata.WP3;
data11=this.state.historydata.WP4;
})
//1秒更新一次数据
this.wghInterval=setInterval(()=>{
//W1&WP1
//var myWeightTag1 = echarts.init(document.getElementById('main1'));
myWeightTag1.setOption({
title: { text: '称重数据1' },
tooltip: {},
legend: {
data:['W1','WP1']
},
xAxis: [
{
type: 'category',
data:data1,
splitLine: {
show: false
}
}
],
yAxis: [
{
type: 'value',
name : ' 1号传感器实际重量与预测重量读数(kg)',
boundaryGap: [0, '100%'],
splitLine: {
show: false
}
}
],
series: [
{
name:'W1',
type: 'line',
data: data4
},
{
name:'WP1',
type: 'line',
data: data8
}
]
});
//W2&WP2
// var myWeightTag2 = echarts.init(document.getElementById('main2'));
myWeightTag2.setOption({
title: { text: '称重数据2' },
tooltip: {},
legend: {
data:['W2','WP2']
},
xAxis: [
{
type: 'category',
data:data1,
splitLine: {
show: false
}
}
],
yAxis: [
{
type: 'value',
name : ' 2号传感器实际重量与预测重量读数(kg)',
boundaryGap: [0, '100%'],
splitLine: {
show: false
}
}
],
series: [
{
name:'W2',
type: 'line',
data: data5
},
{
name:'WP2',
type: 'line',
data: data9
}
]
});
//W3&WP3
// var myWeightTag3 = echarts.init(document.getElementById('main3'));
myWeightTag3.setOption({
title: { text: '称重数据3' },
tooltip: {},
legend: {
data:['W3','WP3']
},
xAxis: [
{
type: 'category',
data:data1,
splitLine: {
show: false
}
}
],
yAxis: [
{
type: 'value',
name : ' 3号传感器实际重量与预测重量读数(kg)',
boundaryGap: [0, '100%'],
splitLine: {
show: false
}
}
],
series: [
{
name:'W3',
type: 'line',
data: data6
},
{
name:'WP3',
type: 'line',
data: data10
}
]
});
//W4&WP4
// var myWeightTag4 = echarts.init(document.getElementById('main4'));
myWeightTag4.setOption({
title: { text: '称重数据4' },
tooltip: {},
legend: {
data0:['W4','WP4']
},
xAxis: [
{
type: 'category',
data:data1,
splitLine: {
show: false
}
}
],
yAxis: [
{
type: 'value',
name : ' 4号传感器实际重量与预测重量读数',
boundaryGap: [0, '100%'],
splitLine: {
show: false
}
}
],
series: [
{
name:'W4',
type: 'line',
data: data7
},
{
name:'WP4',
type: 'line',
data: data11
}
]
});
//W&WP
// var myWeightTag5 = echarts.init(document.getElementById('main5'));
myWeightTag5.setOption({
title: { text: '称重数据' },
tooltip: {},
legend: {
data:['W','WP']
},
xAxis: [
{
type: 'category',
data:data1,
splitLine: {
show: false
}
}
],
yAxis: [
{
type: 'value',
name : ' 总和传感器实际重量与预测重量读数',
boundaryGap: [0, '100%'],
splitLine: {
show: false
}
}
],
series: [
{
name:'W',
type: 'line',
data: data2
},
{
name:'WP',
type: 'line',
data: data3
}
]
});
window.onresize = function(){
myWeightTag1.resize();
myWeightTag2.resize();
myWeightTag3.resize();
myWeightTag4.resize();
myWeightTag5.resize();
};
fetch('/test')
.then((res) => { return res.json() })
.then(data => {
this.setState({updatedata:data});
time=this.state.updatedata.time;
W=this.state.updatedata.W;
WP=this.state.updatedata.WP;
W1=this.state.updatedata.W1;
W2=this.state.updatedata.W2;
W3=this.state.updatedata.W3;
W4=this.state.updatedata.W4;
WP1=this.state.updatedata.WP1;
WP2=this.state.updatedata.WP2;
WP3=this.state.updatedata.WP3;
WP4=this.state.updatedata.WP4;
data1.shift();
data1.push(time);
data2.shift();
data2.push(W);
data3.shift();
data3.push(WP);
data4.shift();
data4.push(W1);
data5.shift();
data5.push(W2);
data6.shift();
data6.push(W3);
data7.shift();
data7.push(W4);
data8.shift();
data8.push(WP1);
data9.shift();
data9.push(WP2);
data10.shift();
data10.push(WP3);
data11.shift();
data11.push(WP4);
})
},1000);
}
render() {
return (
<div>
<Row>
<Col id="main1" style={{ height: 400 }} span={12}/>
<Col id="main2" style={{ height: 400 }} span={12}/>
</Row>
<Row>
<Col id="main3" style={{ height: 400 }} span={12}/>
<Col id="main4" style={{ height: 400 }} span={12}/>
</Row>
<Row id="main5" style={{ height: 400 }}/>
</div>
)
}
}
上传服务器
1.my-app的命令行中执行
npm run build
2.在虚拟机上将build后的index.html和build两个包拷贝到Windows,再通过Moba上传至服务器即可
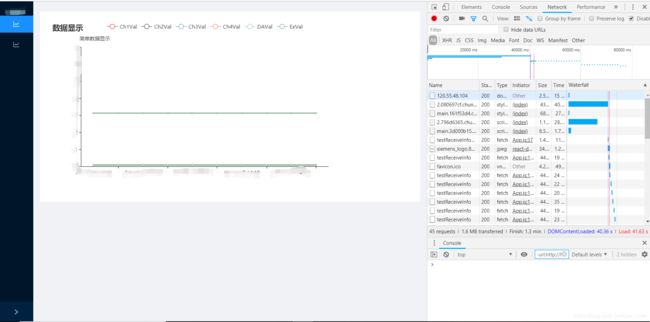
网页显示