检验方法、混淆矩阵、模型评估
- 假设
- 独立性检验
- 秩和检验
- chi squared test X2X2test
- T test
- F test
- confusion matrix
- confusion matrix of classification
- table of confusion
- code
- P-R F1
- code
- ROCReceiver Operating Characteristic
- code
- AUCArea Under ROC Curve
假设
H0 :零假设,不能轻易被否定的命题作为原假设
H1 :把无把握的、不能轻易肯定的命题作为备择假设
如果一个统计检验的结果拒绝零假设(结论不支持零假设),而实际上真实的情况属于零假设,那么称这个检验犯了第一类错误。
反之,如果检验结果支持零假设,而实际上真实的情况属于备择假设,那么称这个检验犯了第二类错误。
尽量使后果严重的错误成为第一类错误.
- 先定义 α 显著水平
- 定义原假设,即按照常理推断出的情况
- 计算 P 值,如果 P>α 则拒绝原假设接受 H1 假设
独立性检验
秩和检验
验证两个样本是否服从同一分布
将两个样本合并后排序,得到每个样本单位的秩次。当几个数据的大小相同秩次却不相同时,最终的秩次取其算术平均。
H0 :两个总体服从相同的分布
H1 :两个总体服从不同的分布
显著水平为 a
求出样本数较少的那个总体的秩和T
查“秩和检验表”,得出临界值 T1(a) , T2(a) ,若 T1(a)<T<T2(a) 则接受 H0
chi squared test ( X2 test)
fo : observed观察值
fe : expected期望值
X2=∑fo−fefe
独立性检验:
| class\item | good | normal | bad | total |
|---|---|---|---|---|
| child | N11 | N12 | N13 | N1⋅ |
| teens | N21 | N22 | N23 | N2⋅ |
| aldot | N31 | N32 | N33 | N3⋅ |
| total | N⋅1 | N⋅2 | N⋅3 | N⋅⋅ |
fe=N⋅1×N1⋅N⋅⋅
Degree of freedom(df) = (total row number - 1)(total column number -1)
T test
bbs
F test
confusion matrix
Wiki
confusion matrix of classification
| actual\class | cat | dog | rabbit |
|---|---|---|---|
| cat | 5 | 3 | 0 |
| dog | 2 | 3 | 1 |
| rabbit | 0 | 2 | 11 |
table of confusion
| correctness\Predict | Positive | Negative |
|---|---|---|
| True | TP | TN |
| False | FP | FN |
Type I error : FP 误判为阳性样本
Type II error: FN 误判为阴性样本
Error=TN+FP4
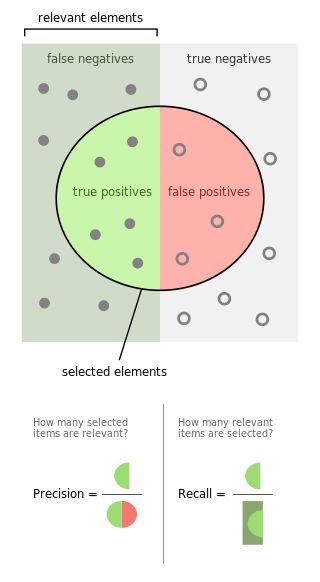
relevant 相关
which is correctly classified
Relevant=TP+FNretrieved 预测为正例的(即检索出的)
selected items,
Retrieved=TP+FPAccuracy
for the cat class
| correctness\Predict | Positive | Negative |
|---|---|---|
| True | 5 | 3 |
| False | 2 | 17 |
code
sklearn
from sklearn.metrics import confusion_matrix
cm = confusion_matrix(y_true, y_pred)
confusion matrix plot
import itertools
import matplotlib.pyplot as plt
import numpy as np
from sklearn.metrics import confusion_matrix
def plot_confusion_matrix(cm, classes,
                          normalize=False,
                          title='Confusion matrix',
                          cmap=plt.cm.Blues):
    """
    This function prints and plots the confusion matrix.
    Normalization can be applied by setting `normalize=True`.

    Usage
    ---
    cnf_matrix = confusion_matrix(y_test, y_pred)
    np.set_printoptions(precision=2)
    plt.figure()
    plot_confusion_matrix(cnf_matrix, classes=class_names, normalize=True,
                          title='Normalized confusion matrix')

    """
    plt.imshow(cm, interpolation='nearest', cmap=cmap)
    plt.title(title)
    plt.colorbar()
    tick_marks = np.arange(len(classes))
    plt.xticks(tick_marks, classes, rotation=45)
    plt.yticks(tick_marks, classes)

    if normalize:
        cm = cm.astype('float') / cm.sum(axis=1)[:, np.newaxis]
        print("Normalized confusion matrix")
    else:
        print('Confusion matrix, without normalization')

    print(cm)

    thresh = cm.max() / 2.
    for i, j in itertools.product(range(cm.shape[0]), range(cm.shape[1])):
        plt.text(j, i, cm[i, j],
                 horizontalalignment="center",
                 color="white" if cm[i, j] > thresh else "black")

    plt.tight_layout()
    plt.ylabel('True label')
    plt.xlabel('Predicted label')
P-R & F1
Wikipedia entry for the Precision and recall
Wikipedia entry for the F1-score
precision查准率
被 f 判定为正例的样本当中有多少实际为真?
How many selected items are relevant?
- Precision=TPTP+FP={relevant}∩{retrieved}{retrieved}
Recall查全率
被正确分类的样本中有多少为真?
How many relevant items are selected?
F1 调和平均
1F1=1p+1R2Fβ 加权调和平均
1Fβ=1p+β2R1+β2
β>1 : Recall(查全)有更大影响, 宁可错杀无辜也不能放过坏人
β<1 : Precision(查准)有更大影响, 尽可能一查一个准减少冤假错案
理解查全率查准率的用处
在医学上HIV阳性就是Positive,但是有True Positive 和 False Positive之分。
实际得了HIV的患者有可能被检测为True Positive也可能被漏查了False Positive,统称为relevant相关。
如果是检验犯了第一类错误那么这个被检验为HIV阳性的的患者就是False Positive假阳性,也就是说他可以回家安心过他的好日子咯!
由于是HIV检测,因此查全率比较重要,不能放过每一个可能的患者啊。真阳TP和假阴FN都是实际得了HIV的患者,所以查全率——真阳占实际得病的比例,就变得非常的重要。
而查准率——真阳占判断为阳性的比例,在抓小偷的时候比较重要,不要造成冤假错案把好人当成小偷了!
code
sklearn
from sklearn.metrics import precision_recall_fscore_support
precision_recall_fscore_support(y_true, y_pred, beta=1.0, average='macro')
ROC(Receiver Operating Characteristic)
True Positive Rate
TPR=TPTP+FN=PresicionFalse Positive Rate
- FPR=FPTN+FP
将点集 (predict,y) 根据predict probability从小到大排列
设置截断点cut point从0一直到1, 求出TPR, FPR。
假设当前阶段点为0.4,那么大于0.4的都预测为1
| proba | 0.05 | 0.14 | 0.32 | 0.46 | 0.57 | 0.68 | 0.73 | 0.89 | 0.93 |
|---|---|---|---|---|---|---|---|---|---|
| predict | 0 | 0 | 0 | 1 | 1 | 1 | 1 | 1 | 1 |
| y | 0 | 0 | 1 | 0 | 0 | 1 | 0 | 1 | 1 |
| Count | TN+1 | TN+1 | FN+1 | FP+1 | FP+1 | TP+1 | FP+1 | TP+1 | TP+1 |
predict 为1的就是Positive,为0的就是Negative。
predict == y 的就是True,否则为False。
confusion matrix
| Actual\Predict | 0 | 1 |
|---|---|---|
| 0 | 2 | 3 |
| 1 | 1 | 3 |
table of confusion
| Correctness\Predict | Positive | Negative |
|---|---|---|
| True | 3 | 2 |
| False | 3 | 1 |
(FPR,TPR)=(25,34)
code
import matplotlib.pyplot as plt
from sklearn.metrics import roc_curve

fpr,tpr,thresholds = roc_curve(y_true, y_score)
plt.plot(fpr,tpr, label='roc')
plt.legend()
AUC(Area Under ROC Curve)
即ROC曲线的面积。
AUC与排序误差 lrank 的关系:
from sklearn.metrics import roc_auc_score
AUC = roc_auc_score(y_true, y_scores)
sklearn classification metrics
