吴恩达机器学习作业——K-means聚类
将K-means算法用于图片压缩(减少颜色数量,只保留最普遍的颜色)
1.练习K-means(找到最近的聚类中心)
X样本数300*2,找到离前三个样本距离最近的聚类中心(三个),并标明位置(第几个聚类中心离样本最近)
fprintf('Finding closest centroids.\n\n');
K = 3; % 3 Centroids
initial_centroids = [3 3; 6 2; 8 5];
idx = findClosestCentroids(X, initial_centroids);
fprintf('Closest centroids for the first 3 examples: \n')%计算前三个样本距离最近的聚类中心
fprintf(' %d', idx(1:3));
fprintf('\n(the closest centroids should be 1, 3, 2 respectively)\n');
fprintf('Program paused. Press enter to continue.\n');
其中,findClosestCentroids如下:
function idx = findClosestCentroids(X, centroids)
K = size(centroids, 1);
idx = zeros(size(X,1), 1);
for i=1:length(idx)
    distance = pdist2(centroids,X(i,:));
    [C idx(i)] = min(distance);
end
end
[Y,U]=min(A):返回行向量Y和U,Y向量记录A的每列的最小值,U向量记录每列最小值的行号。
结果:
2计算聚类中心均值(更新聚类中心)
fprintf('\nComputing centroids means.\n\n');
centroids = computeCentroids(X, idx, K);
fprintf('Centroids computed after initial finding of closest centroids: \n')
fprintf(' %f %f \n' , centroids');
fprintf('\n(the centroids should be\n');
fprintf('   [ 2.428301 3.157924 ]\n');
fprintf('   [ 5.813503 2.633656 ]\n');
fprintf('   [ 7.119387 3.616684 ]\n\n');
computeCentroids函数如下:
function centroids = computeCentroids(X, idx, K)
[m n] = size(X);
centroids = zeros(K, n);
for i=1:K
    centroids(i,:) = mean( X( find(idx==i),:));
end
end
find()函数的基本功能是返回向量或者矩阵中不为0的元素的位置索引。
例:
>> X = [1 0 4 -3 0 0 0 8 6];
>> ind = find(X)
ind =
1 3 4 8 9
3在数据集上实现k-means聚类
脚本:
fprintf('\nRunning K-Means clustering on example dataset.\n\n');
load('ex7data2.mat');
K = 3;
max_iters = 10;
initial_centroids = [3 3; 6 2; 8 5];
[centroids, idx] = runkMeans(X, initial_centroids, max_iters, true);
fprintf('\nK-Means Done.\n\n');
runkMeans函数:
function [centroids, idx] = runkMeans(X, initial_centroids, ...
                                      max_iters, plot_progress)
%RUNKMEANS runs the K-Means algorithm on data matrix X, where each row of X
%is a single example
%   [centroids, idx] = RUNKMEANS(X, initial_centroids, max_iters, ...
%   plot_progress) runs the K-Means algorithm on data matrix X, where each
%   row of X is a single example. It uses initial_centroids used as the
%   initial centroids. max_iters specifies the total number of interactions
%   of K-Means to execute. plot_progress is a true/false flag that
%   indicates if the function should also plot its progress as the
%   learning happens. This is set to false by default. runkMeans returns
%   centroids, a Kxn matrix of the computed centroids and idx, a m x 1
%   vector of centroid assignments (i.e. each entry in range [1..K])
%

% Set default value for plot progress
if ~exist('plot_progress', 'var') || isempty(plot_progress)
    plot_progress = false;
end

% Plot the data if we are plotting progress
if plot_progress
    figure;
    hold on;
end

% Initialize values
[m n] = size(X);
K = size(initial_centroids, 1);
centroids = initial_centroids;
previous_centroids = centroids;
idx = zeros(m, 1);

% Run K-Means
for i=1:max_iters

    % Output progress
    fprintf('K-Means iteration %d/%d...\n', i, max_iters);
    if exist('OCTAVE_VERSION')
        fflush(stdout);%fflush(stdout):清空输出缓冲区,并把缓冲区内容输出。
    end

    % For each example in X, assign it to the closest centroid
    idx = findClosestCentroids(X, centroids);

    % Optionally, plot progress here
    if plot_progress
        plotProgresskMeans(X, centroids, previous_centroids, idx, K, i);
        previous_centroids = centroids;
        fprintf('Press enter to continue.\n');
        pause;
    end

    % Given the memberships, compute new centroids
    centroids = computeCentroids(X, idx, K);
end

% Hold off if we are plotting progress
if plot_progress
    hold off;
end

end
plotProgresskMeans函数:
function plotProgresskMeans(X, centroids, previous, idx, K, i)
% Plot the examples
plotDataPoints(X, idx, K);

% Plot the centroids as black x's
plot(centroids(:,1), centroids(:,2), 'x', ...
     'MarkerEdgeColor','k', ...
     'MarkerSize', 10, 'LineWidth', 3);

% Plot the history of the centroids with lines
for j=1:size(centroids,1)
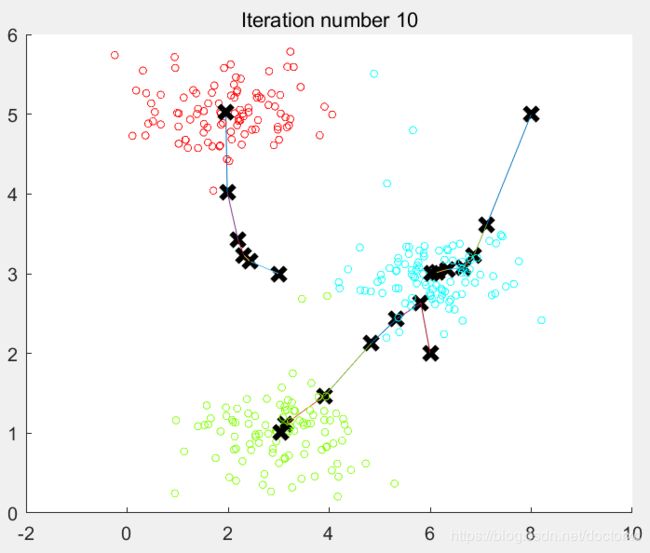
    drawLine(centroids(j, :), previous(j, :));%上一个聚类中心与新的聚类中心连线。
end

% Title
title(sprintf('Iteration number %d', i))

end
运行结果:
4图像压缩
基本函数已经编写完成,接下来进行图像压缩。
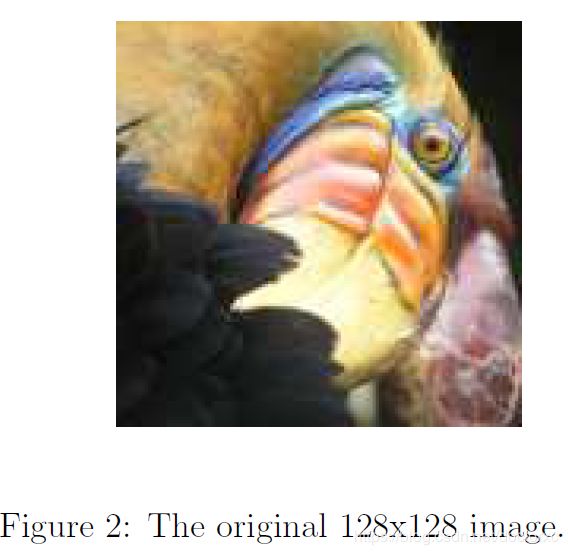
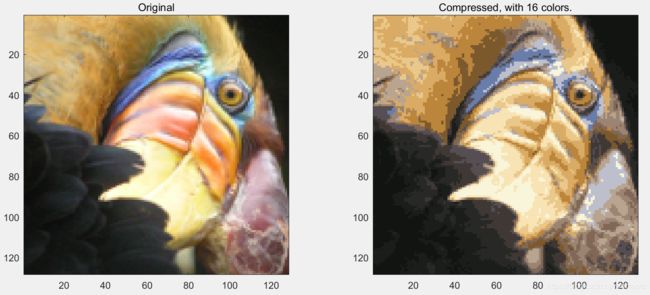
目的:将这个128*128像素的图像,选取最普遍的16个颜色。
图像前后对比:压缩前每个像素占24bits空间,共占128*128*24=393216bits。
压缩后每个像素占4bits空间,每个颜色(包含RGB)占24bits空间,共占16*24+128*128*4=65920bits,将近压缩前的1/6。
脚本:
fprintf('\nRunning K-Means clustering on pixels from an image.\n\n');
A = double(imread('bird_small.png'));%加载图像,A为128*128*3的向量。

% If imread does not work for you, you can try instead
%   load ('bird_small.mat');

A = A / 255; % Divide by 255 so that all values are in the range 0 - 1
img_size = size(A);
X = reshape(A, img_size(1) * img_size(2), 3);%将X变为二维向量,N*3,N为像素点,3列分别为RGB/255的值。
K = 16;
max_iters = 10;
initial_centroids = kMeansInitCentroids(X, K);
[centroids, idx] = runkMeans(X, initial_centroids, max_iters);
matlab中A的数据格式
每个像素点的RGB/255的值,代表颜色。
kMeansInitCentroids函数(随机初始化):
function centroids = kMeansInitCentroids(X, K)
centroids = zeros(K, size(X, 2));
randidx = randperm(size(X,1));%randperm(n)返回一行包含从1到n的整数。
centroids = X(randidx(1:K),:);%随机选从1-n的16个数作为初始聚类中心。(只显示16个颜色)
end
5压缩并显示图像
脚本:
fprintf('\nApplying K-Means to compress an image.\n\n');
idx = findClosestCentroids(X, centroids);
X_recovered = centroids(idx,:);
X_recovered = reshape(X_recovered, img_size(1), img_size(2), 3); %重新将压缩后的图像变为3维。
subplot(1, 2, 1);
imagesc(A); %将数组A中的数据显示为一个图像。
title('Original');
subplot(1, 2, 2);
imagesc(X_recovered)
title(sprintf('Compressed, with %d colors.', K));
运行结果:


