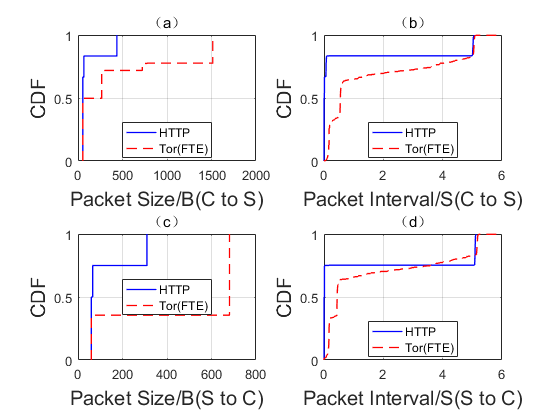
matlab画CDF曲线
CDF(cumulative distribution function)叫做累积分布函数
描述一个实数随机变量X的概率分布,是概率密度函数的积分。
我觉得它的最主要作用就是观测某些数值也就是随机变量的取值在那个附近出现的概率比较大,它是一个增函数. 可以有效的处理一些异常值.
随机变量小于或者等于某个数值的概率P(X<=x),即:F(x) = P(X<=x)
累积分布函数(cumulative distribution function):对连续函数,所有小于等于a的值,其出现概率的和。F(a)=P(x<=a)
下面我们来讲一下怎么用matlab来画我们的累计分布图.
比如我们有一组CSV的数据,我们把这个存储这个数据的文件取名叫做test.csv
116,218,119
123,219,106
113,219,119
117,232,105
118,208,117
116,222,106
117,221,119
129,232,108
124,234,118
124,234,107
132,234,117
125,226,106
135,225,112
126,231,107
134,250,113
141,223,107
118,260,113
117,249,107
112,261,118
118,234,107
118,257,119
119,256,105
117,281,118
129,266,107
131,260,119
143,239,105
128,263,120
135,267,107
127,259,118
119,285,103
159,269,119
138,264,106
142,259,122
128,285,111
158,269,133
129,264,106
130,259,124
137,228,105
139,262,126
130,249,111
114,275,117
126,227,107
119,230,118
118,224,107
130,226,118
126,227,106
129,264,114
125,254,106
132,252,114
130,229,106
135,229,117
121,251,108
129,243,119
125,226,105
113,275,114
120,255,104
111,274,119
118,255,107
115,274,120
129,260,107
126,249,119
135,235,109
136,281,125
132,266,106
134,263,122
123,255,108
129,258,116
127,264,105
113,257,122
115,264,102
129,257,133
126,275,104
126,272,123
122,260,108
128,256,120
117,265,105
117,254,122
117,263,109
123,238,125
130,285,106
130,282,121
152,251,106
131,233,111%read data into matirx
%http function
fid = fopen('F:\test\test.csv','rt'); %首先打开文件把数据读取出来
C = textscan(fid, '%f %f %f', 'Delimiter',',');
fclose(fid); %之后把数据扫描进C这个变量中,我们是按照浮点类型的形式来处理我们的数据的
%由于我们的数据有三列,所有我们这里取了三个%f出来,根据不同的数据我们取不同的格式说明符号.可以用类似C语言.每个数据之间是按照","来做分割.
%Delimiter表示的是取某些分割符来切分数据,再后面我们写逗号,表示按照逗号来分割数据
data1 = deal(C{1});
% 每一列数据表示的一次随机实验中取到的随机变量,所以我们分别处理
%这两组数据,以此类推.
data2 = deal(C{2});
%xlim([50:1500]);
h1=cdfplot(data1);
axis([50 500 0 1]);
set(h1,'color','b','Linewidth',3);
hold on;
h2=cdfplot(data2);% 在matlab中画图我们使用cdfplot,这个命令
%legend('b','Location','best');
set(h2,'color','r','Linewidth',1);
%axis([50 1500 0 1]);
legend('a','b','Location','best');
xlabel('Zhai You','FontSize',30);
ylabel('CDF','FontSize',30);
title('')数据不方便放出,放源码
%read data into matirx
%http function
fid = fopen('F:\test\figure1.csv','rt'); %首先打开文件把数据读取出来
C = textscan(fid, '%f %f %f', 'Delimiter',',');
fclose(fid); %之后把数据扫描进C这个变量中,我们是按照浮点类型的形式来处理我们的数据的
%由于我们的数据有三列,所有我们这里取了三个%f出来,根据不同的数据我们取不同的格式说明符号.可以用类似C语言.每个数据之间是按照","来做分割.
%Delimiter表示的是取某些分割符来切分数据,再后面我们写逗号,表示按照逗号来分割数据

data1 = deal(C{1});
% 每一列数据表示的一次随机实验中取到的随机变量,所以我们分别处理
%这两组数据,以此类推.
data2 = deal(C{2});

subplot(2,2,1);
%xlim([50:1500]);
h1=cdfplot(data1);


set(h1,'color','b','Linewidth',1);
hold on;
h2=cdfplotG(data2);% 在matlab中画图我们使用cdfplot,这个命令
%legend('b','Location','best');
set(h2,'color','r','Linewidth',1);
legend('HTTPS','Tor(FTE)','Location','best');
xlabel('Packet Size/B(C to S)','FontSize',15);
ylabel('CDF','FontSize',15);
title('(a)')

fid = fopen('F:\test\figure2.csv','rt'); %首先打开文件把数据读取出来
C = textscan(fid, '%f %f %f', 'Delimiter',',');
fclose(fid); %之后把数据扫描进C这个变量中,我们是按照浮点类型的形式来处理我们的数据的
%由于我们的数据有三列,所有我们这里取了三个%f出来,根据不同的数据我们取不同的格式说明符号.可以用类似C语言.每个数据之间是按照","来做分割.
%Delimiter表示的是取某些分割符来切分数据,再后面我们写逗号,表示按照逗号来分割数据

data1 = deal(C{1});
% 每一列数据表示的一次随机实验中取到的随机变量,所以我们分别处理
%这两组数据,以此类推.
data2 = deal(C{2});

subplot(2,2,2);
%xlim([50:1500]);
h1=cdfplot(data1);


set(h1,'color','b','Linewidth',1);
hold on;
h2=cdfplotG(data2);% 在matlab中画图我们使用cdfplot,这个命令
%legend('b','Location','best');
set(h2,'color','r','Linewidth',1);
legend('HTTPS','Tor(FTE)','Location','best');
xlabel('Packet Interval/S(C to S)','FontSize',15);
ylabel('CDF','FontSize',15);
title('(b)')

fid = fopen('F:\test\figure3.csv','rt'); %首先打开文件把数据读取出来
C = textscan(fid, '%f %f %f', 'Delimiter',',');
fclose(fid); %之后把数据扫描进C这个变量中,我们是按照浮点类型的形式来处理我们的数据的
%由于我们的数据有三列,所有我们这里取了三个%f出来,根据不同的数据我们取不同的格式说明符号.可以用类似C语言.每个数据之间是按照","来做分割.
%Delimiter表示的是取某些分割符来切分数据,再后面我们写逗号,表示按照逗号来分割数据

data1 = deal(C{1});
% 每一列数据表示的一次随机实验中取到的随机变量,所以我们分别处理
%这两组数据,以此类推.
data2 = deal(C{2});

subplot(2,2,3);
%xlim([50:1500]);
h1=cdfplot(data1);


set(h1,'color','b','Linewidth',1);
hold on;
h2=cdfplotG(data2);% 在matlab中画图我们使用cdfplot,这个命令
%legend('b','Location','best');
set(h2,'color','r','Linewidth',1);
legend('HTTPS','Tor(FTE)','Location','best');
xlabel('Packet Size/B(S to C)','FontSize',15);
ylabel('CDF','FontSize',15);
title('(c)')

fid = fopen('F:\test\figure4.csv','rt'); %首先打开文件把数据读取出来
C = textscan(fid, '%f %f %f', 'Delimiter',',');
fclose(fid); %之后把数据扫描进C这个变量中,我们是按照浮点类型的形式来处理我们的数据的
%由于我们的数据有三列,所有我们这里取了三个%f出来,根据不同的数据我们取不同的格式说明符号.可以用类似C语言.每个数据之间是按照","来做分割.
%Delimiter表示的是取某些分割符来切分数据,再后面我们写逗号,表示按照逗号来分割数据

data1 = deal(C{1});
% 每一列数据表示的一次随机实验中取到的随机变量,所以我们分别处理
%这两组数据,以此类推.
data2 = deal(C{2});

subplot(2,2,4);
%xlim([50:1500]);
h1=cdfplot(data1);


set(h1,'color','b','Linewidth',1);
hold on;
h2=cdfplotG(data2);% 在matlab中画图我们使用cdfplot,这个命令
%legend('b','Location','best');
set(h2,'color','r','Linewidth',1);
legend('HTTPS','Tor(FTE)','Location','best');
xlabel('Packet Interval/S(S to C)','FontSize',15);
ylabel('CDF','FontSize',15);
title('(d)')
%read data into matirx
%http function
fid = fopen('F:\test\figure5.csv','rt'); %首先打开文件把数据读取出来
C = textscan(fid, '%f %f %f', 'Delimiter',',');
fclose(fid); %之后把数据扫描进C这个变量中,我们是按照浮点类型的形式来处理我们的数据的
%由于我们的数据有三列,所有我们这里取了三个%f出来,根据不同的数据我们取不同的格式说明符号.可以用类似C语言.每个数据之间是按照","来做分割.
%Delimiter表示的是取某些分割符来切分数据,再后面我们写逗号,表示按照逗号来分割数据
data1 = deal(C{1});
% 每一列数据表示的一次随机实验中取到的随机变量,所以我们分别处理
%这两组数据,以此类推.
data2 = deal(C{2});
subplot(2,2,1);
%xlim([50:1500]);
h1=cdfplot(data1);
set(h1,'color','b','Linewidth',1);
hold on;
h2=cdfplotG(data2);% 在matlab中画图我们使用cdfplot,这个命令
%legend('b','Location','best');
set(h2,'color','r','Linewidth',1);
legend('HTTP','Tor(FTE)','Location','best');
xlabel('Packet Size/B(C to S)','FontSize',15);
ylabel('CDF','FontSize',15);
title('(a)')
fid = fopen('F:\test\figure6.csv','rt'); %首先打开文件把数据读取出来
C = textscan(fid, '%f %f %f', 'Delimiter',',');
fclose(fid); %之后把数据扫描进C这个变量中,我们是按照浮点类型的形式来处理我们的数据的
%由于我们的数据有三列,所有我们这里取了三个%f出来,根据不同的数据我们取不同的格式说明符号.可以用类似C语言.每个数据之间是按照","来做分割.
%Delimiter表示的是取某些分割符来切分数据,再后面我们写逗号,表示按照逗号来分割数据
data1 = deal(C{1});
% 每一列数据表示的一次随机实验中取到的随机变量,所以我们分别处理
%这两组数据,以此类推.
data2 = deal(C{2});
subplot(2,2,2);
%xlim([50:1500]);
h1=cdfplot(data1);
set(h1,'color','b','Linewidth',1);
hold on;
h2=cdfplotG(data2);% 在matlab中画图我们使用cdfplot,这个命令
%legend('b','Location','best');
set(h2,'color','r','Linewidth',1);
legend('HTTP','Tor(FTE)','Location','best');
xlabel('Packet Interval/S(C to S)','FontSize',15);
ylabel('CDF','FontSize',15);
title('(b)')
fid = fopen('F:\test\figure7.csv','rt'); %首先打开文件把数据读取出来
C = textscan(fid, '%f %f %f', 'Delimiter',',');
fclose(fid); %之后把数据扫描进C这个变量中,我们是按照浮点类型的形式来处理我们的数据的
%由于我们的数据有三列,所有我们这里取了三个%f出来,根据不同的数据我们取不同的格式说明符号.可以用类似C语言.每个数据之间是按照","来做分割.
%Delimiter表示的是取某些分割符来切分数据,再后面我们写逗号,表示按照逗号来分割数据
data1 = deal(C{1});
% 每一列数据表示的一次随机实验中取到的随机变量,所以我们分别处理
%这两组数据,以此类推.
data2 = deal(C{2});
subplot(2,2,3);
%xlim([50:1500]);
h1=cdfplot(data1);
set(h1,'color','b','Linewidth',1);
hold on;
h2=cdfplotG(data2);% 在matlab中画图我们使用cdfplot,这个命令
%legend('b','Location','best');
set(h2,'color','r','Linewidth',1);
legend('HTTP','Tor(FTE)','Location','best');
xlabel('Packet Size/B(S to C)','FontSize',15);
ylabel('CDF','FontSize',15);
title('(c)')
fid = fopen('F:\test\figure8.csv','rt'); %首先打开文件把数据读取出来
C = textscan(fid, '%f %f %f', 'Delimiter',',');
fclose(fid); %之后把数据扫描进C这个变量中,我们是按照浮点类型的形式来处理我们的数据的
%由于我们的数据有三列,所有我们这里取了三个%f出来,根据不同的数据我们取不同的格式说明符号.可以用类似C语言.每个数据之间是按照","来做分割.
%Delimiter表示的是取某些分割符来切分数据,再后面我们写逗号,表示按照逗号来分割数据
data1 = deal(C{1});
% 每一列数据表示的一次随机实验中取到的随机变量,所以我们分别处理
%这两组数据,以此类推.
data2 = deal(C{2});
subplot(2,2,4);
%xlim([50:1500]);
h1=cdfplot(data1);
set(h1,'color','b','Linewidth',1);
hold on;
h2=cdfplotG(data2);% 在matlab中画图我们使用cdfplot,这个命令
%legend('b','Location','best');
set(h2,'color','r','Linewidth',1);
legend('HTTP','Tor(FTE)','Location','best');
xlabel('Packet Interval/S(S to C)','FontSize',15);
ylabel('CDF','FontSize',15);
title('(d)')我改了cdfplot函数代码:命名为cdfplotG方便为了画出虚线
function [handleCDF,stats] = cdfplotG(x)
%CDFPLOT Display an empirical cumulative distribution function.
%   CDFPLOT(X) plots an empirical cumulative distribution function (CDF)
%   of the observations in the data sample vector X. X may be a row or
%   column vector, and represents a random sample of observations from
%   some underlying distribution.
%
%   H = CDFPLOT(X) plots F(x), the empirical (or sample) CDF versus the
%   observations in X. The empirical CDF, F(x), is defined as follows:
%
%   F(x) = (Number of observations <= x)/(Total number of observations)
%
%   for all values in the sample vector X. If X contains missing data
%   indicated by NaN's (IEEE arithmetic representation for
%   Not-a-Number), the missing observations will be ignored.
%
%   H is the handle of the empirical CDF curve (a Handle Graphics 'line'
%   object).
%
%   [H,STATS] = CDFPLOT(X) also returns a statistical summary structure
%   with the following fields:
%
%      STATS.min    = minimum value of the vector X.
%      STATS.max    = maximum value of the vector X.
%      STATS.mean   = sample mean of the vector X.
%      STATS.median = sample median (50th percentile) of the vector X.
%      STATS.std    = sample standard deviation of the vector X.
%
%   In addition to qualitative visual benefits, the empirical CDF is
%   useful for general-purpose goodness-of-fit hypothesis testing, such
%   as the Kolmogorov-Smirnov tests in which the test statistic is the
%   largest deviation of the empirical CDF from a hypothesized theoretical
%   CDF.
%
%   See also QQPLOT, KSTEST, KSTEST2, LILLIETEST.

% Copyright 1993-2011 The MathWorks, Inc.


% Get sample cdf, display error message if any
[yy,xx,~,~,eid] = cdfcalc(x);
if isequal(eid,'VectorRequired')
    error(message('stats:cdfplot:VectorRequired'));
elseif isequal(eid,'NotEnoughData')
    error(message('stats:cdfplot:NotEnoughData'));
end

% Create vectors for plotting
k = length(xx);
n = reshape(repmat(1:k, 2, 1), 2*k, 1);
xCDF    = [-Inf; xx(n); Inf];
yCDF    = [0; 0; yy(1+n)];

%
% Now plot the sample (empirical) CDF staircase.
%

hCDF = plot(xCDF , yCDF,'--');
if (nargout>0), handleCDF=hCDF; end
grid  ('on')
xlabel(getString(message('stats:cdfplot:LabelX')))
ylabel(getString(message('stats:cdfplot:LabelFx')))
title (getString(message('stats:cdfplot:Title')))

%
% Compute summary statistics if requested.
%

if nargout > 1
   stats.min    =  min(x);
   stats.max    =  max(x);
   stats.mean   =  mean(x);
   stats.median =  median(x);
   stats.std    =  std(x);
end


