%matplotlib inline
import matplotlib.pyplot as plt
import numpy as np
import pandas as pd
def read_dataset(fname):
data = pd.read_csv(fname, index_col=0)
data.drop(['Name', 'Ticket', 'Cabin'], axis=1, inplace=True)
data['Sex'] = (data['Sex'] == 'male').astype('int')
labels = data['Embarked'].unique().tolist()
data['Embarked'] = data['Embarked'].apply(lambda n: labels.index(n))
data = data.fillna(0)
return data
train = read_dataset('datasets/titanic/train.csv')
train.head(10)
.dataframe tbody tr th:only-of-type { vertical-align: middle; } .dataframe tbody tr th { vertical-align: top; } .dataframe thead th { text-align: right; }
|
Survived |
Pclass |
Sex |
Age |
SibSp |
Parch |
Fare |
Embarked |
| PassengerId |
|
|
|
|
|
|
|
|
| 1 |
0 |
3 |
1 |
22.0 |
1 |
0 |
7.2500 |
0 |
| 2 |
1 |
1 |
0 |
38.0 |
1 |
0 |
71.2833 |
1 |
| 3 |
1 |
3 |
0 |
26.0 |
0 |
0 |
7.9250 |
0 |
| 4 |
1 |
1 |
0 |
35.0 |
1 |
0 |
53.1000 |
0 |
| 5 |
0 |
3 |
1 |
35.0 |
0 |
0 |
8.0500 |
0 |
| 6 |
0 |
3 |
1 |
0.0 |
0 |
0 |
8.4583 |
2 |
| 7 |
0 |
1 |
1 |
54.0 |
0 |
0 |
51.8625 |
0 |
| 8 |
0 |
3 |
1 |
2.0 |
3 |
1 |
21.0750 |
0 |
| 9 |
1 |
3 |
0 |
27.0 |
0 |
2 |
11.1333 |
0 |
| 10 |
1 |
2 |
0 |
14.0 |
1 |
0 |
30.0708 |
1 |
from sklearn.model_selection import train_test_split
y = train['Survived'].values
X = train.drop(['Survived'], axis=1)
X_train, X_test, y_train, y_test = train_test_split(X, y, test_size=0.2)
print('train dataset: {0}; test dataset: {1}'.format(
X_train.shape, X_test.shape))
train dataset: (712, 7); test dataset: (179, 7)
from sklearn.tree import DecisionTreeClassifier

clf = DecisionTreeClassifier()
clf.fit(X_train, y_train)
train_score = clf.score(X_train, y_train)
test_score = clf.score(X_test, y_test)
print('train score: {0}; test score: {1}'.format(train_score, test_score))
train score: 0.9859550561797753; test score: 0.8044692737430168
def cv_score(d):
clf = DecisionTreeClassifier(max_depth=d)
clf.fit(X_train, y_train)
tr_score = clf.score(X_train, y_train)
cv_score = clf.score(X_test, y_test)
return (tr_score, cv_score)
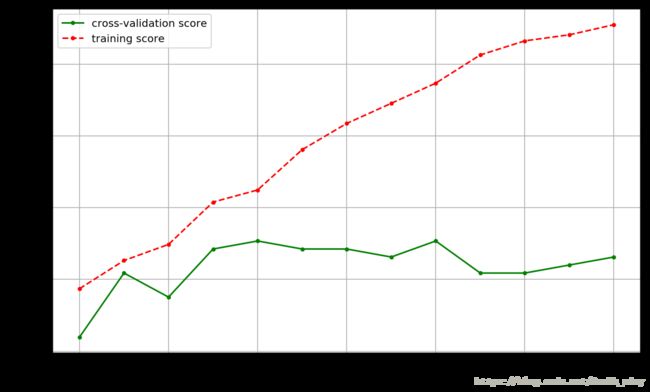
depths = range(2, 15)
scores = [cv_score(d) for d in depths]
tr_scores = [s[0] for s in scores]
cv_scores = [s[1] for s in scores]
best_score_index = np.argmax(cv_scores)
best_score = cv_scores[best_score_index]
best_param = depths[best_score_index]
print('best param: {0}; best score: {1}'.format(best_param, best_score))
plt.figure(figsize=(10, 6), dpi=144)
plt.grid()
plt.xlabel('max depth of decision tree')
plt.ylabel('score')
plt.plot(depths, cv_scores, '.g-', label='cross-validation score')
plt.plot(depths, tr_scores, '.r--', label='training score')
plt.legend()
best param: 6; best score: 0.8268156424581006

def cv_score(val):
clf = DecisionTreeClassifier(criterion='gini', min_impurity_split=val)
clf.fit(X_train, y_train)
tr_score = clf.score(X_train, y_train)
cv_score = clf.score(X_test, y_test)
return (tr_score, cv_score)
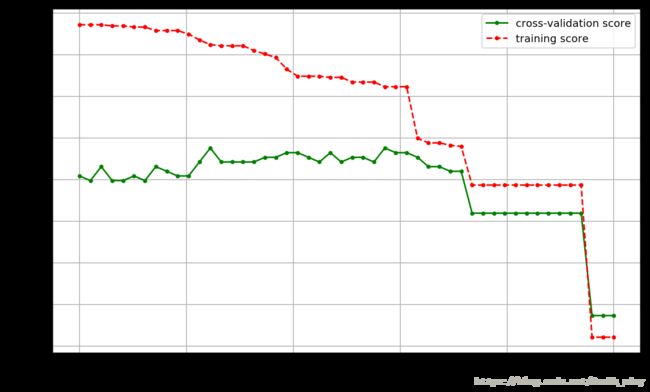
values = np.linspace(0, 0.5, 50)
scores = [cv_score(v) for v in values]
tr_scores = [s[0] for s in scores]
cv_scores = [s[1] for s in scores]
best_score_index = np.argmax(cv_scores)
best_score = cv_scores[best_score_index]
best_param = values[best_score_index]
print('best param: {0}; best score: {1}'.format(best_param, best_score))
plt.figure(figsize=(10, 6), dpi=144)
plt.grid()
plt.xlabel('threshold of entropy')
plt.ylabel('score')
plt.plot(values, cv_scores, '.g-', label='cross-validation score')
plt.plot(values, tr_scores, '.r--', label='training score')
plt.legend()
best param: 0.12244897959183673; best score: 0.8379888268156425

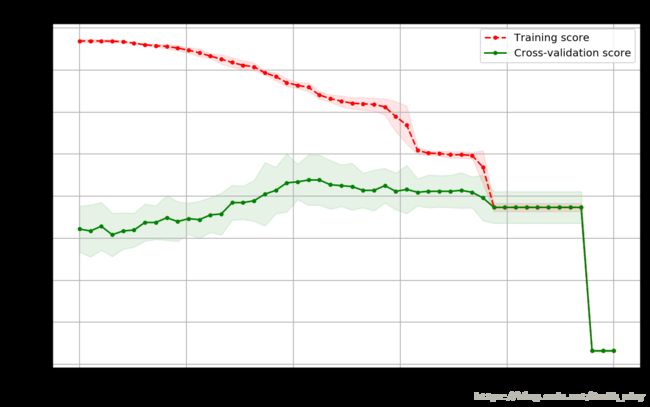
def plot_curve(train_sizes, cv_results, xlabel):
    train_scores_mean = cv_results['mean_train_score']
    train_scores_std = cv_results['std_train_score']
    test_scores_mean = cv_results['mean_test_score']
    test_scores_std = cv_results['std_test_score']
    plt.figure(figsize=(10, 6), dpi=144)
    plt.title('parameters turning')
    plt.grid()
    plt.xlabel(xlabel)
    plt.ylabel('score')
    plt.fill_between(train_sizes,
                     train_scores_mean - train_scores_std,
                     train_scores_mean + train_scores_std,
                     alpha=0.1, color="r")
    plt.fill_between(train_sizes,
                     test_scores_mean - test_scores_std,
                     test_scores_mean + test_scores_std,
                     alpha=0.1, color="g")
    plt.plot(train_sizes, train_scores_mean, '.--', color="r",
             label="Training score")
    plt.plot(train_sizes, test_scores_mean, '.-', color="g",
             label="Cross-validation score")

    plt.legend(loc="best")
from sklearn.model_selection import GridSearchCV
thresholds = np.linspace(0, 0.5, 50)
param_grid = {'min_impurity_split': thresholds}
clf = GridSearchCV(DecisionTreeClassifier(), param_grid, cv=5)
clf.fit(X, y)
print("best param: {0}\nbest score: {1}".format(clf.best_params_,
clf.best_score_))
plot_curve(thresholds, clf.cv_results_, xlabel='gini thresholds')

from sklearn.model_selection import GridSearchCV
entropy_thresholds = np.linspace(0, 1, 50)
gini_thresholds = np.linspace(0, 0.5, 50)
param_grid = [{'criterion': ['entropy'],
'min_impurity_split': entropy_thresholds},
{'criterion': ['gini'],
'min_impurity_split': gini_thresholds},
{'max_depth': range(2, 10)},
{'min_samples_split': range(2, 30, 2)}]
clf = GridSearchCV(DecisionTreeClassifier(), param_grid, cv=5)
clf.fit(X, y)
print("best param: {0}\nbest score: {1}".format(clf.best_params_,
clf.best_score_))


