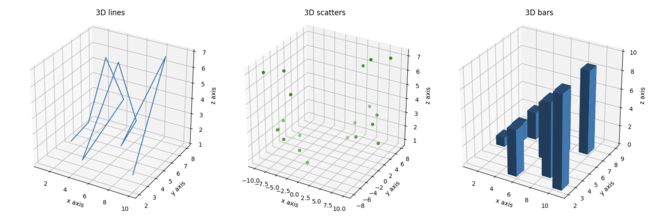
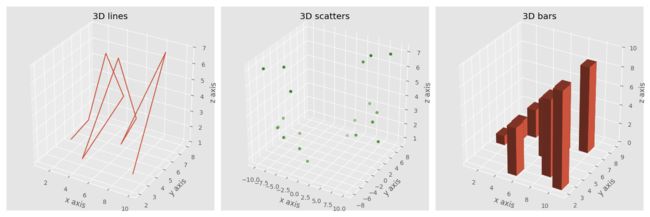
效果图
Code
from mpl_toolkits.mplot3d import axes3d  # projection='3d' 需要
import matplotlib.pyplot as plt
from matplotlib import style
import numpy as np

style.use('fivethirtyeight')  # ggplot

fig = plt.figure(figsize=(15, 5))

# ax1, 3D lines 折线图
ax1 = fig.add_subplot(131, projection='3d')

x = [1, 2, 3, 4, 5, 6, 7, 8, 9, 10]
y = [5, 6, 7, 8, 2, 5, 6, 3, 7, 2]
z = np.array([[1, 2, 6, 3, 2, 7, 3, 3, 7, 2]])

ax1.plot_wireframe(x, y, z)  # z 必须要是2维 np array

ax1.set_xlabel('x axis')
ax1.set_ylabel('y axis')
ax1.set_zlabel('z axis')

ax1.set_title('3D lines\n')

## ax2, 3D scatters 散点图
ax2 = fig.add_subplot(132, projection='3d')

x2 = [-1, -2, -3, -4, -5, -6, -7, -8, -9, -10]
y2 = [-5, -6, -7, -8, -2, -5, -6, -3, -7, -2]
z2 = [1, 2, 6, 3, 2, 7, 3, 3, 7, 2]

ax2.scatter(x, y, z, c='g', marker='o')
ax2.scatter(x2, y2, z2, c='g', marker='o')

ax2.set_xlabel('x axis')
ax2.set_ylabel('y axis')
ax2.set_zlabel('z axis')

ax2.set_title('3D scatters\n')

## ax3, 3D bar 条形图
ax3 = fig.add_subplot(133, projection='3d')

x3 = [1, 2, 3, 4, 5, 6, 7, 8, 9, 10]
y3 = [5, 6, 7, 8, 2, 5, 6, 3, 7, 2]
z3 = np.zeros(10)  # z3 暂不赋值,下面 dz 直接设置 height

# dx,dy,dz: The width, depth, and height of the bars, respectively
dx = np.ones(10)
dy = np.ones(10)
dz = [1, 2, 3, 4, 5, 6, 7, 8, 9, 10]

ax3.bar3d(x3, y3, z3, dx, dy, dz)

ax3.set_xlabel('x axis')
ax3.set_ylabel('y axis')
ax3.set_zlabel('z axis')

ax3.set_title('3D bars\n')

plt.show()


