# -*- coding:UTF-8 -*-

import numpy as np
import matplotlib.pyplot as plt
from matplotlib.ticker import MultipleLocator
from pylab import mpl


import sys
reload(sys)
sys.setdefaultencoding('utf8')

xmajorLocator = MultipleLocator(10* 1) #将x轴主刻度标签设置为10* 1的倍数
ymajorLocator = MultipleLocator(0.1* 1) #将y轴主刻度标签设置为0.1 * 1的倍数

# 设置中文字体
mpl.rcParams['font.sans-serif'] = ['SimHei']

# 导入文件数据
#data = np.loadtxt('test44.txt', delimiter=None, dtype=float )
#data = [[1,2],[3,4],[5,6]]
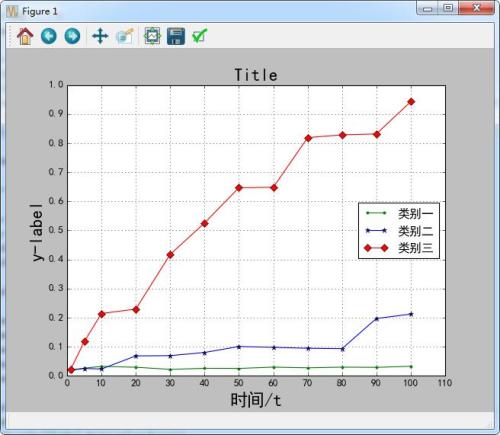
data = [[1,5,10,20,30,40,50,60,70,80,90,100],[0.0201,0.0262,0.0324,0.0295,0.0221,0.0258,0.0254,0.0299,0.0275,0.0299,0.0291,0.0328],
[0.0193,0.0254,0.0234,0.0684,0.0693,0.0803,0.1008,0.098,0.0947,0.0934,0.1971,0.2123],[0.0209,0.1176,0.2143,0.2295,0.4176,0.5258,0.6471,0.6484,0.8193,0.829,0.832,0.943]]

data = np.array(data)

# 截取数组数据

x = data[0] #时间
y = data[1] # 类别一的Y值
y2 = data[2] #类别二的Y值
y3 = data[3] #类别三的Y值

plt.figure(num=1, figsize=(8, 6))

ax = plt.subplot(111)
ax.xaxis.set_major_locator(xmajorLocator)
ax.yaxis.set_major_locator(ymajorLocator)
ax.xaxis.grid(True, which='major') #x坐标轴的网格使用主刻度
ax.yaxis.grid(True, which='major') #x坐标轴的网格使用主刻度

plt.xlabel('时间/t',fontsize='xx-large')#Valid font size are large, None, medium, smaller, small, x-large, xx-small, larger, x-small, xx-large
plt.ylabel('y-label',fontsize='xx-large')
plt.title('Title',fontsize='xx-large')
plt.xlim(0, 110)
plt.ylim(0, 1)

line1, = ax.plot(x, y, 'g.-',label="类别一",)

line2, = ax.plot(x,y2,'b*-',label="类别二",)

line3, = ax.plot(x,y3,'rD-',label="类别三",)

ax.legend((line1, line2,line3),('类别一','类别二','类别三'),loc=5) # loc可为1、2、3、4、5、6,分别为不同的位置
plt.show()

