Definitions
Sparkify is a brand-new music streaming startup seeking continuous growth. It has an ever-growing user base and has collected a huge amount of data about user activities. Sparkify has offered a paid service for the users to access more songs of high quality. From the user activities they find that sometimes users like to downgrade their level or directly confirm cancellation. The team wants to analyze this huge amount of data to predict whether a user will downgrade from premium to free tier or cancel service directly, so they can adjust their service and offering more discounts and incentives potentially saving the business.
The data is in JSON format, it represents user activities. Whenever a user listens to a song, logout, like a song or hearing an ad, there will be a new record generated.
Problem Description
Given the user activies data, we must construct a classification prediction model to judge if a user will downgrade or cancel service. It is a typical machine-learning problem, and because of the huge amount (about 12GB), we choose to use Spark, a brilliant distributive computing framework.
We read the JSON data into spark, do some data wrangling and perform the EDA tasks to deeply understanding the data, demonstrate the findings using data visualization. Then we construct several classification models and evaluate them, choosing the best as our final solution.
Evaluation Metrics
We use ROC curve as the evalutaion metrics of classifier's performance. ROC curve is a graphical plot that summarises how a classification system performs and allows us to compare the performace of different classifers. We compute the area under curve (AUC) from ROC plots, the bigger the AUC the better.
Analysis
EDA
The original data has the following schema:
root
 |-- artist: string (nullable = true)
 |-- auth: string (nullable = true)
 |-- firstName: string (nullable = true)
 |-- gender: string (nullable = true)
 |-- itemInSession: long (nullable = true)
 |-- lastName: string (nullable = true)
 |-- length: double (nullable = true)
 |-- level: string (nullable = true)
 |-- location: string (nullable = true)
 |-- method: string (nullable = true)
 |-- page: string (nullable = true)
 |-- registration: long (nullable = true)
 |-- sessionId: long (nullable = true)
 |-- song: string (nullable = true)
 |-- status: long (nullable = true)
 |-- ts: long (nullable = true)
 |-- userAgent: string (nullable = true)
 |-- userId: string (nullable = true)
There are 8346 records with no user ID, I simply delete them, because these users are likely guests, they haven't register our app and haven't enjoyed any service, they are useless to our model, so we can ignore them. And a descriptive statistics about the length feature shows that there is no abnormals in it:
+-------+-----------------+
|summary|           length|
+-------+-----------------+
|  count|           228108|
|   mean|249.1171819778458|
| stddev|99.23517921058361|
|    min|          0.78322|
|    max|       3024.66567|
+-------+-----------------+
The location feature represents the users location, such as "Boston-Cambridge-Newton, MA-NH", we need to extract the area such as "MA-NH" from it, because metroplitan area such as MA-NH may be an important feature. So I creates two more features: address and area, like this:
+-----------------------+------+
|address                |area  |
+-----------------------+------+
|Bakersfield            | CA   |
|Boston-Cambridge-Newton| MA-NH|
|Bakersfield            | CA   |
|Boston-Cambridge-Newton| MA-NH|
|Bakersfield            | CA   |
+-----------------------+------+
Features ts and registration represents time info in timestamp format. Feature ts represents log date, it ranges from 2018-10-01 00:01:57 to 2018-12-03 01:11:16 with no abnormals; feature registration represents registration date, it ranges from 2018-03-18 13:44:35 to 2018-11-26 15:49:14 with no abnormals. These features may contain important information about when user registers or do actions in our app. I create another two features registration_date and log_date, then I extract date and time information from it: month, day, weekday, hour and whether is a weekend or not. After doing all these processing I finally got:
root
 |-- artist: string (nullable = true)
 |-- auth: string (nullable = true)
 |-- firstName: string (nullable = true)
 |-- gender: string (nullable = true)
 |-- itemInSession: long (nullable = true)
 |-- lastName: string (nullable = true)
 |-- length: double (nullable = true)
 |-- level: string (nullable = true)
 |-- location: string (nullable = true)
 |-- method: string (nullable = true)
 |-- page: string (nullable = true)
 |-- registration: long (nullable = true)
 |-- sessionId: long (nullable = true)
 |-- song: string (nullable = true)
 |-- status: long (nullable = true)
 |-- ts: long (nullable = true)
 |-- userAgent: string (nullable = true)
 |-- userId: string (nullable = true)
 |-- registration_date: timestamp (nullable = true)
 |-- log_date: timestamp (nullable = true)
 |-- address: string (nullable = true)
 |-- area: string (nullable = true)
 |-- reg_month: integer (nullable = true)
 |-- reg_day: integer (nullable = true)
 |-- reg_weekday: integer (nullable = true)
 |-- reg_hour: integer (nullable = true)
 |-- reg_weekend: integer (nullable = true)
 |-- log_month: integer (nullable = true)
 |-- log_day: integer (nullable = true)
 |-- log_weekday: integer (nullable = true)
 |-- log_hour: integer (nullable = true)
 |-- log_weekend: integer (nullable = true)
Visualization
构建了数据可视化来更好地展示你在数据探索性分析时的发现。保证可视化方案适用于你要绘制的数据图表
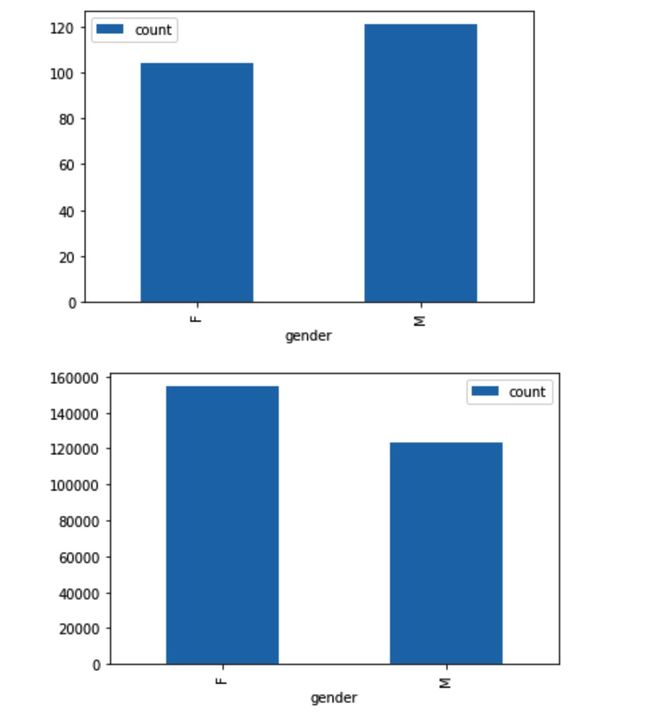
1. Visualization about gender
There are more male audience than females, but females generates more records.
2. Visualization about area and address
California state, Los Angeles-Long Beach-Anaheim and New York-Newark-Jersey City outweighs a lot as hot spots.
3. Visualization about page
Page events statistics, Submit Downgrade, Downgrade and Cancellation Confirmation should be put focus on. I create a label churn using these three page events.
related_events = ['Downgrade', 'Submit Downgrade', 'Cancellation Confirmation']
mark_churn_events = F.udf(lambda page: 1 if page in related_events else 0, IntegerType())
df_cleaned = df_cleaned.withColumn('churn', mark_churn_events('page'))
4. Visualization about level
Paid and free users statistics, paid users outweighs free users.
5. Relationship between churn and weekday
Users registered in weekend tend to do more churns, but users tend to do less churns at weekend.
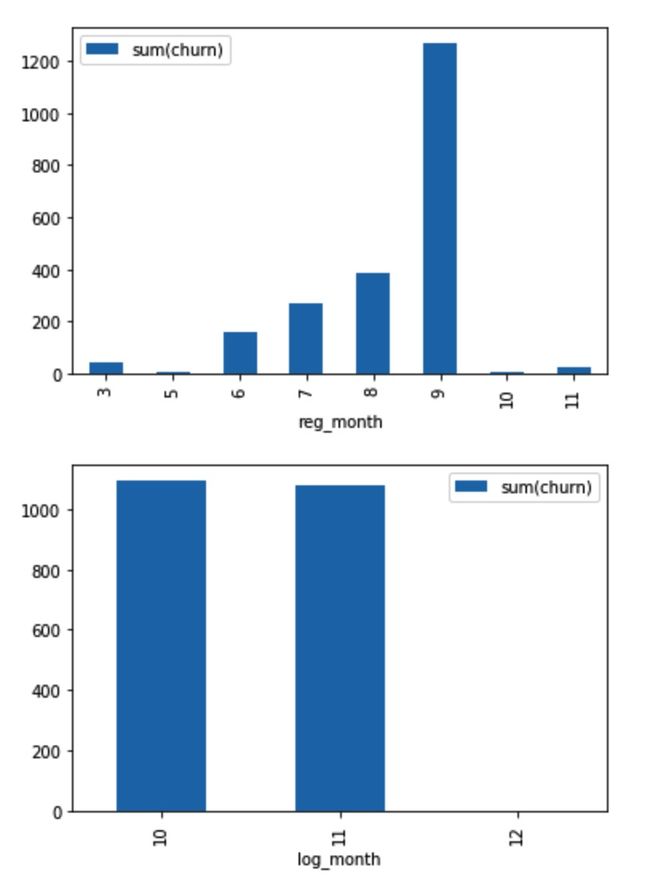
6. Relationship about churn and month
Users registered in September more likely to churn, but users tends to do no churn in December.
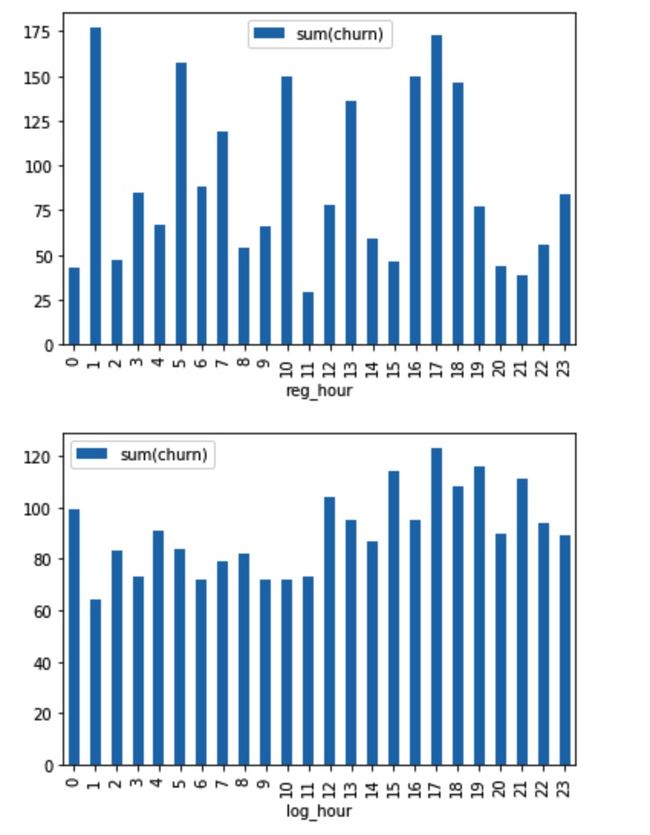
7. Relationship about churn and hour
There's no obvious relation between registration hour and churn, but users tend to churn from 12 p.m to 0 a.m.
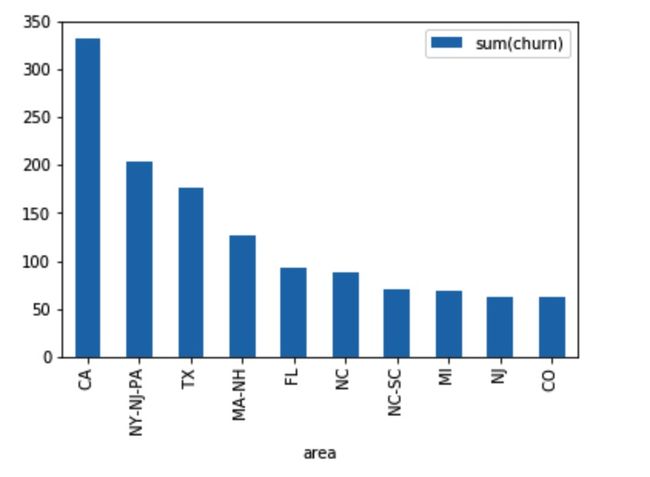
8. Relationship about area and churn
Some areas are more likely to churn such as CA.
9. Relationship about level and churn
Of course paid users are likely to churn than free users.
10. Relationship about average number of songs between home visit and churn
Inspired by the course, I create a feature indicating the average number of songs a user listened between two home visits. And analyze it with the churn feature:
Users who churned tend to listen much less songs than others.
Modeling
Preprocessing
I finally choose log_weekday, reg_weekday, log_month, reg_month, area, level, avg_songs as the useful features, churn as the label. But area and level are all string features and cannot directly use in machine learning model, So I first use a StringIndexer to transform them into numerical values, assemble all features using VectorAssember and scale them using StandardScaler:
# first convert categorical feature into numerical feature using StringIndexer
df_data = df_cleaned.select('log_weekday', 'reg_weekday', 'log_month', 'reg_month', 'area', 'level', 'avg_songs', 'churn')
areaIndexer = StringIndexer(inputCol='area', outputCol='area_feature')
levelIndexer = StringIndexer(inputCol='level', outputCol='level_feature')
# then assemble values into vector and scale them
assembler = VectorAssembler(inputCols=['log_weekday', 'reg_weekday', 'log_month', 'reg_month', 'area_feature', 'level_feature', 'avg_songs'], outputCol='features_vec')
standardScaler = StandardScaler(inputCol='features_vec', outputCol='features')

df_data = areaIndexer.fit(df_data).transform(df_data)
df_data = levelIndexer.fit(df_data).transform(df_data)
df_data = assembler.transform(df_data)
df_data = standardScaler.fit(df_data).transform(df_data)
df_data = df_data.withColumnRenamed('churn', 'label')
Model Training
I split the dataset into train, validation and test set, in the ratio of 80%-10%-10%. Then I choose 3 classifiers as candidates: logistic regression, random forest and SVM. By combining cross validator, binary classification evaluator with these classifiers respectively, I trained and validate them with the evaluator and get the AUC value from them, take logistic regression as an example:
lr = LogisticRegression(maxIter=20)
paramGrid = ParamGridBuilder().addGrid(lr.regParam, [0.3, 0.01]).addGrid(lr.elasticNetParam, [1.0, 0.8]).build()
evaluator = BinaryClassificationEvaluator()
crossval = CrossValidator(estimator=lr,
                          estimatorParamMaps=paramGrid,
                          evaluator=evaluator,
                          numFolds=3)

lr_model = lr.fit(train)
print('AUC value: {}'.format(evaluator.evaluate(lr_model.transform(validation))))
I got:
| Classifier | AUC |
|---|---|
| LogisticRegression | 0.62 |
| RandomForestClassifier | 0.59 |
| LinearSVC | 0.61 |
So logistic regression wins the game, and I evaluate it on test set, in score of 0.61.
# logistic regression is the best, try it on test set
# AUC value: 0.6124042843876265
print('AUC value: {}'.format(evaluator.evaluate(lr_model.transform(test))))
Results
The process of model training lies on not only the algorithms, but also the cross validation mechanics. By using ParamGridBuilder we can explore the parameter space and detect the best model efficiently. And we determine which model is the best by using AUC, the more this value approaches 1 the better.
Conclusion
A complete solution of data science project contains the following important parts:
- Think carefully and identity what the problem is, where to get the data;
- Deep understanding of the data and the business;
- Detailed data wrangling, EDA and feature engineering;
- Model training combining with hyper-parameter tuning;
- Choosing the appropriate evaluator to train the best model;
- Deliver this model to improve the current business and continuously monitor the effects;
Step 3 and 4 are the most challenging parts. When doing data wrangling and EDA, we have to think carefully and dig deeply into the data, trying to construct new features on space dimension or time dimension, to find relationships between the features and the object. Then based on the deep understanding about the data, we can train a model that is much better than train it directly: Any model training without EDA is a mistake !
If we want to improve the implementation, we at least have two paths:
On one hand, we can reconsider our data, trying to collect more data related, for example, we can analyze the location data, mining more data about the regions, or extract more information in ts and registration feature, finding out the holidays, or add some data about the singer, the sales volume of the songs (whether it is a best seller), let a lot more features in and doing PCA if necessary.
On the other hand, we can choose more classifers such as gradient boosted trees and naive bayes, or using more advanced deep learning techniques to improve the performance.
References
- Spark Python API Docs
- StackOverflow


