这里讲一下怎么样用d3.js,输入一个数据list,根据数据画一个带有坐标轴的简单直方图.
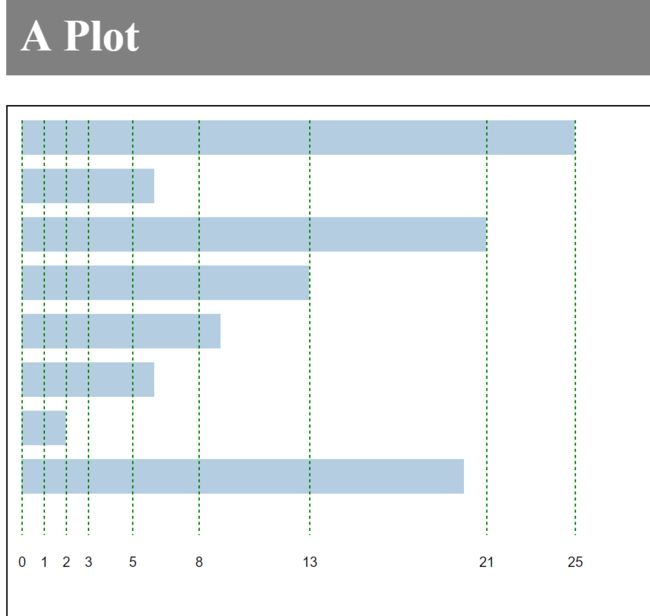
以下是目标效果.
直方图部分
引入d3.
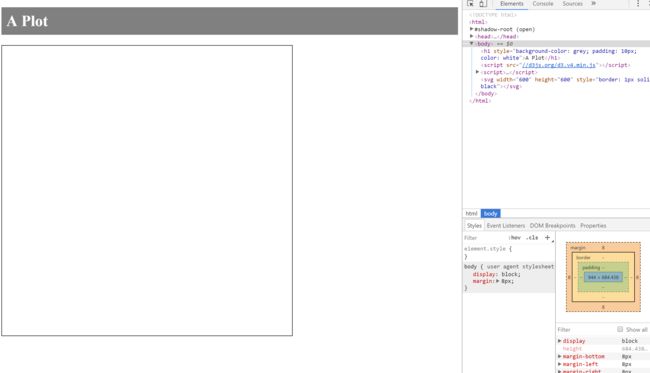
画矢量图需要画布,首先,创建新svg:
我的数据为一个数组:var dataset = [ 25, 6, 21 , 17 , 13 , 9, 6, 2, 20 ];
我想让我的直方图向右,纵向排列.
每一个矩形的x向长度既表示了数据的大小.
那么第一个要解决的问题就是,怎么把原始数据换算成像素,肯定不能直接画25px,6px...
这个时候就需要一个比例尺了.
d3提供的连续比例尺可以这么写:
var linear = d3.scaleLinear()
        .domain([0, d3.max(dataset)])
        .range([ 0,400]);
定义变量linear为一个连续比例尺,定义域.domain,值域.range.
在这里,定义域 .domain([0, d3.max(dataset)])是指,我比例尺输入的数据最小为0,最大是原dataset里最大的那个数(25),所以输入比例尺的定义域为0到25,换算后的值域为0到400px,既——数据0对应0px,数据25对应400px.
有了长度比例尺,就可以画直方图了.
var rectHeight = 30;
svg.selectAll("rect")
    .data(dataset)
    .enter()
    .append("rect")
    .attr("x",0)
    .attr("y",function(d,i){
         return i * (rectHeight + 5);
    })
    .attr("width",function(d){
         return linear(d);
    })
    .attr("height",rectHeight)
    .attr("fill","steelblue")
    .attr("opacity",0.4);
在这里,先定义了每一个矩形框框的高度为30px,
.data()绑定数据dataset
.enter()方法是专门用在这种,根据输入数据动态新建元素的情况下的,具体可以参考官方说明:
# selection.enter() <>
Returns the enter selection: placeholder nodes for each datum that had no corresponding DOM element in the selection. (The enter selection is empty for selections not returned by selection.data.)
**The enter selection is typically used to create “missing” elements corresponding to new data. **For example, to create DIV elements from an array of numbers:
var div = d3.select("body") .selectAll("div")
  .data([4, 8, 15, 16, 23, 42])
  .enter()
  .append("div")
  .text(function(d) { return d; });
If the body is initially empty, the above code will create six new DIV elements, append them to the body in-order, and assign their text content as the associated (string-coerced) number:
4
8
15
16
23
42
Conceptually, the enter selection’s placeholders are pointers to the parent element (in this example, the document body). The enter selection is typically only used transiently to append elements, and is often merged with the update selection after appending, such that modifications can be applied to both entering and updating elements.
所以,在这里,我们既是根据输入dataset来新建
怎么根据呢?
属性设置里面:
    .attr("x",0)
    .attr("y",function(d,i){
         return i * (rectHeight + 5);
    })
    .attr("width",function(d){
         return linear(d);
    })
    .attr("height",rectHeight)
表示的是,对于每一个新建的矩形
可以理解为,在(0,0)放置一个高度为30px的矩形,再在(0,35)放一个,再在(0,70)放一个,再在(0,105)放一个...
而矩形的宽度要和我们的数据保持一致,所以width属性,输入了一个无名函数
function(d){
    return linear(d);
}
这个函数是什么意思呢,当选择集需要使用被绑定的数据时,常需要这么使用。其包含两个参数,其中:
- d 代表数据,也就是与某元素绑定的数据
- i 代表索引,代表数据的索引号,从 0 开始
所以在这里,每个矩形的宽度,是通过比例尺返回的像素值return linear(d).
当完成这一部后,我们的矩形就显示出来了. 其中最长的一根应该就是代表25的400像素,看右边监视栏的第一个rect,正好就是400的宽度.
坐标轴部分
有了直方图的矩形,我们现在来画一个坐标轴.
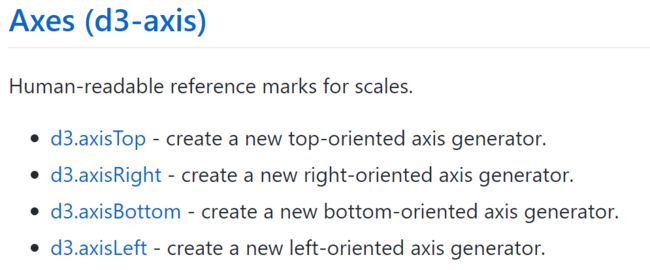
坐标轴有4种:
分别是什么样子的呢,我们来试一试.
在API使用规范里这样写到:
Regardless of orientation, axes are always rendered at the origin. To change the position of the axis with respect to the chart, specify a transform attribute on the containing element. For example:
d3.select("body").append("svg")
        .attr("width", 1440)
        .attr("height", 30)
    .append("g")
        .attr("transform", "translate(0,30)")
        .call(axis);
意思是,在使用坐标轴的时候,必须先添加一个.call(axis)调用axis. 而默认坐标轴都是从原点(0,0)开始画,如果需要调整位置,在属性transform里设置translate(x,y)
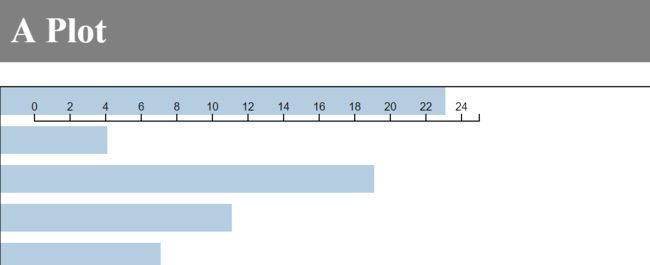
所以,我们测试一下在(30,30)画一个axisTop.
var axis = d3.axisTop(linear);//新建一个axisTop坐标轴,比例尺为linear
  svg.append("g") //调用
        .attr("transform", "translate(30,30)")//位置(30,30)
        .call(axis);
我们得到结果如下:
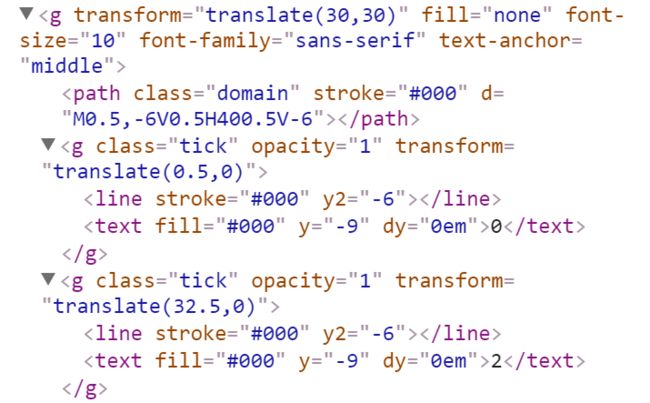
而每个坐标轴是由哪些部分组成的呢:
一个横线轴
而且在每一个
那么,我们要怎么才能修改这些呢.
查阅API得知
axis.tickValues([values])可以直接用来传入一系列坐标轴分割点.
试一试:
var axis = d3.axisTop(linear)
          .tickValues([0,1, 2, 3, 5, 8, 13, 21,25]);
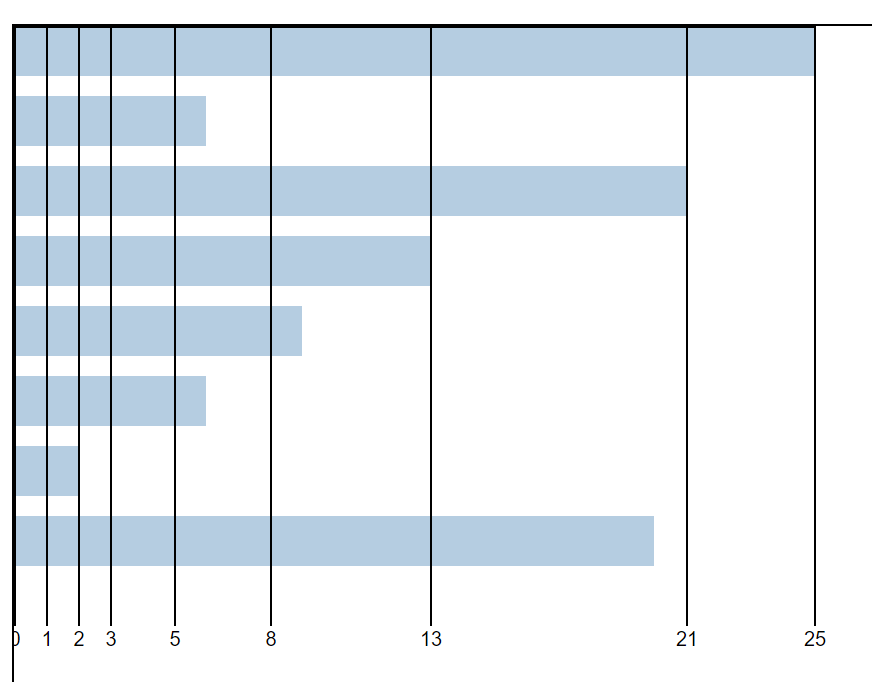
果然,坐标轴根据我们输入的数据进行了分割.
我们还可以用
axis.tickSize([size])来更改每一个分割的大小.
这一次我们画一个向下的坐标轴,设定每一个分割为300px:
var axis = d3.axisBottom(linear)
          .tickSize(300)
          .tickValues([0,1, 2, 3, 5, 8, 13, 21,25]);

svg.append("g") //调用
        .attr("transform", "translate(0,0)")//位置(0,0)
        .call(axis);
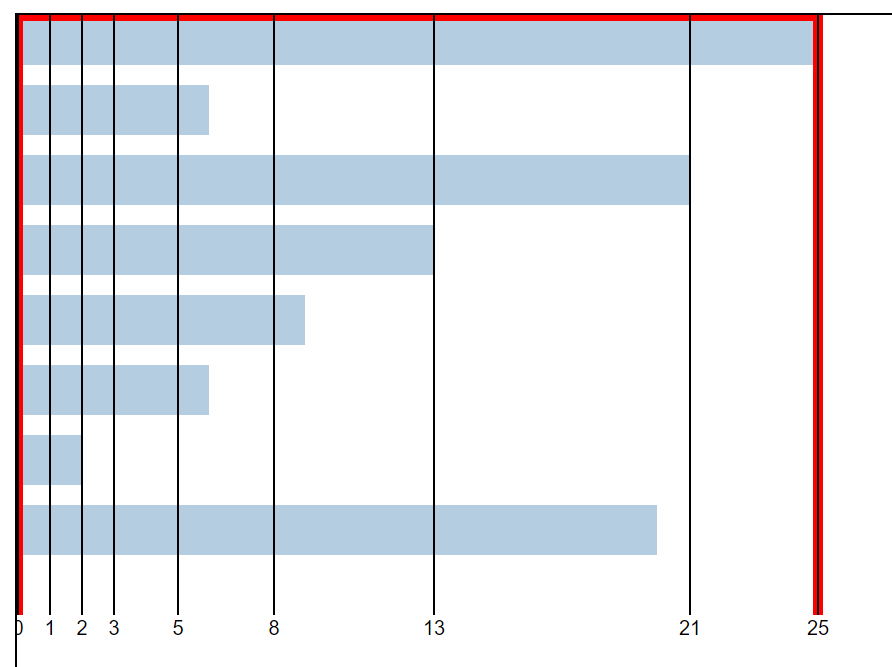
除此之外,我们还可以改样式. 而且在每一个
我们知道了每一个坐标轴有一个
最终,实现效果:var axis = d3.axisBottom(linear)
.tickSize(300)
.tickValues([0,1, 2, 3, 5, 8, 13, 21,25]);
svg.append("g")
.attr("transform", "translate(10,10)")
.call(axis);
svg.selectAll("line")
.attr("stroke","green")
.attr("stroke-dasharray","2.2");
svg.selectAll("text")
.attr("dy","2em");
svg.select(".domain").remove()
