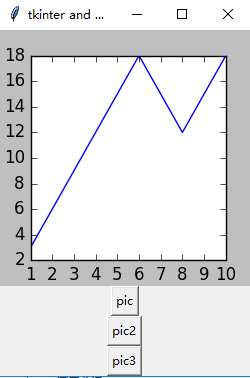
使用matplotlib绘制图像,并显示到thinter已有的画布中,如何进行两个包的连接,具体案例如下:
 1 import matplotlib
 2 matplotlib.use('TkAgg')
 3 from matplotlib.backends.backend_tkagg import FigureCanvasTkAgg
 4 from matplotlib.figure import Figure
 5 from tkinter import *
 6 root = Tk()
 7 root.title("tkinter and matplotlib")
 8 f = Figure(figsize=(2.52, 2.56), dpi=100)#figsize定义图像大小,dpi定义像素
 9 f_plot = f.add_subplot(111)#定义画布中的位置
10 def other_picture_alg(): #数据相关的算法应该与plot分离开
11     x = [1, 2, 3, 4, 5, 6, 7, 8, 9, 10]
12     y = [3, 6, 9, 12, 15, 18, 15, 12, 15, 18]
13     return x, y
14 def draw_picture():
15     f_plot.clear()
16     x = [1, 2, 3, 4, 5, 6, 7, 8, 9, 10] #关于数据的部分可以提取出来
17     y = [3, 6, 9, 12, 15, 18, 21, 24, 27, 30]
18     f_plot.plot(x, y)
19     canvs.draw()
20 def draw_picture2():
21     f_plot.clear()
22     x = [1, 2, 3, 4, 5, 6, 7, 8, 9, 10] #关于数据的部分可以提取出来
23     y = [2, 4, 6, 8, 10, 8, 6, 4, 2, 0]
24     f_plot.plot(x, y)
25     canvs.draw()
26 def draw_picture3():
27     f_plot.clear()
28     x, y = other_picture_alg() # 使用由算法生成的数据,可以避免重复的运算过程
29     f_plot.plot(x, y)
30     canvs.draw()
31 canvs = FigureCanvasTkAgg(f, root)#f是定义的图像,root是tkinter中画布的定义位置
32 canvs.get_tk_widget().pack(side=TOP, fill=BOTH, expand=1)
33 Button(root, text='pic', command=draw_picture).pack()
34 Button(root, text='pic2', command=draw_picture2).pack()
35 Button(root, text='pic3', command=draw_picture3).pack()
36 root.mainloop()
运行结果如图:
如图所示,先定义画布大小以及图像位置,pic显示是直线,坐标点手动定义;pic2显示是折线,坐标点手动定义;pic3显示是折线,坐标点手动定义;


