基于 TensorFlow 的逻辑回归详解
- Logistic ( 逻辑回归 )
- 一、基本概念简介以及理论讲解
- 1.1、回归
- 1.2、Logistic 函数的逆函数 –> Logit 函数
- 1.2.1、伯努利分布
- 1.2.2 Logit 函数
- 1.3、对数几率函数的逆函数 Logistic 函数
- 1.4、多分类应用 — Softmax 回归
- 1.4.1 Softmax 函数定义以及 Loss Function
- 1.4.2 其他相关的 Softmax 回归的一些操作
- 二、TensorFlow 代码区实践
- 2.1 单变量 Logistic 回归
- 2.2 基于 skflow 的单变量逻辑回归
- 2.3 基于 keras 的单变量逻辑回归
- 一、基本概念简介以及理论讲解
Logistic ( 逻辑回归 )
一、基本概念简介以及理论讲解
1.1、回归
- 回归一般用于解决那些连续变量的问题,如:线性回归,它是通过最小化误差函数,来不断拟合一条直线,以计算出权重 w 和 偏差 b 的过程,它的目标是基于一个连续方程去预测一个值。
- 这里要讲解的 Logistic 回归,却常用于分类问题,也就是将观测值贴上某个标签,或者是分入某个预先定义的类别之中。回归应该是寻找一个连续值,而分类是寻找一个离散值。故理解常用于分类问题的 Logistic 回归的关键在于,我们是将先寻找到的该样本属于某个类可能性的连续值映射到了某一个类(我们一般将某一个类的 label 建模成离散值)。这就是 Logistic 常用于分类却叫做回归的原因 。
1.2、Logistic 函数的逆函数 –> Logit 函数
- 在了解 Logistic 函数之前,我们先来了解一下它的逆函数 Logit 函数,即对数几率函数。正如我们所了解的一样逆函数之间关于 y = x 直线对称,自变量 x 和因变量 y 互为对偶位置,因此,Logit 函数和 Logistic 函数有很多性质都有关联。
- Logit 函数的变量需要一个概率值 p 作为自变量,如果是二分类问题,确切一点是伯努利分布(即二项分布),如果是多分类问题,则是多项分布。
1.2.1、伯努利分布
- 它又称为二项分布,也就是说它只能表示成功和失败两种情况。当是二分类问题时,都可用该分布
- 取 1,表示成功,以概率 p 表示
- 取 0,即失败,以概率 q = 1-p 表示
- 伯努利分布的概率函数可以表示为: Pr(X=1) = 1 - Pr(X=0) = 1-q = p
- 此外,Logistic 函数也是属于广义线性模型(GLM)的一种,在建立广义线性模型之前,我们还需要从线性函数开始,从独立的连续变量映射到一个概率分布。
- 而如果是针对二分类的 Logistic 回归,由于是二分类属于二值选项问题,我们一般会将上面的概率分布建模成一个伯努利分布(即二项分布),而将上述的独立的连续变量建模成线性方程回归后的 y 值,最后再通过连接函数,这里采用对数几率函数 Ligit ,将连续的 y = wx +b 的线性连续变量映射到二项分布。
- 只是,我们先将 Logit 函数,它的映射是从自变量 p(即二项分布发生的几率) 到 函数值(即y=wx+b,也就是连接函数y即 logit(p)) 的映射,故逆函数 Logistic 函数即上一段所讲,便可以将连续值映射到二项分布,从而用做分类问题。
1.2.2 Logit 函数
- Logit 函数又称对数几率函数,其中 p 是二项分布中事件发生的概率,用发生的概率 p 除以不发生的概率 1-p, 即(p /1-p)称为事件的发生率,对其取对数,就成了对数几率函数(Logit 函数) 。
logit(p)=log(p1−p) l o g i t ( p ) = l o g ( p 1 − p )
- 从图中我们可以看到,该函数实现了从区间[0,1] 到区间(- ∞ ∞ ,+ ∞ ∞ ) 之间的映。我们只要将 y 用一个输入的线性函数替换,那么久实现了输入的线性变化到区间 [0,1] 之间的映射。
1.3、对数几率函数的逆函数 Logistic 函数
由上面的讲解可知,我们先计算对数几率函数的逆函数后得如下结果:这里我们记 logistic(z) 为 g (z), 转换之后, logit−1(z) l o g i t − 1 ( z ) 就是上面提到的二项分布发生的概率 p
logit−1(z)=logistic(z)=g(z)=11+exp(−z) l o g i t − 1 ( z ) = l o g i s t i c ( z ) = g ( z ) = 1 1 + e x p ( − z )
它是一个 Sigmoid 函数。图像如下:
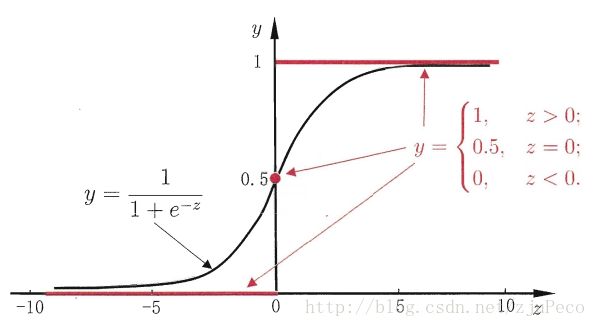
其中,我们认为 Sigmoid 函数最为漂亮的是它的求导后形式非常简介、易用。如下:
函数:f(z)=11+e−z 函 数 : f ( z ) = 1 1 + e − z
导数:f′(z)=f(z)(1−f(z)) 导 数 : f ′ ( z ) = f ( z ) ( 1 − f ( z ) )
- 这个导函数很重要,读者可以自行推导,个人认为这是最为重要的基础知识, 推导过程如下:
f′(z)=(11+e−z)′=e−z(1+e−z)2=1+e−z−1(1+e−z)2=1(1+e−z)(1−1(1+e−z))=f(z)(1−f(z)) f ′ ( z ) = ( 1 1 + e − z ) ′ = e − z ( 1 + e − z ) 2 = 1 + e − z − 1 ( 1 + e − z ) 2 = 1 ( 1 + e − z ) ( 1 − 1 ( 1 + e − z ) ) = f ( z ) ( 1 − f ( z ) )
- 然后我们将 z 换成 θ1 θ 1 x+ θ0 θ 0 ,可以得到逻辑回归模型的参数形式:
p(x;a,b)=11+e−(θ1x+θ0)……(1) p ( x ; a , b ) = 1 1 + e − ( θ 1 x + θ 0 ) … … ( 1 )
(注:当然可以将 z 替换成多维度的线性回归方程如: z=θTx=θ0x0+θ1x1+...+θnxn=∑ni=0θixi z = θ T x = θ 0 x 0 + θ 1 x 1 + . . . + θ n x n = ∑ i = 0 n θ i x i 读者可自行推理)
- 于是我们可以构造预测函数如下:
hθ(x)=g(θTx)=11+e−(θTx) h θ ( x ) = g ( θ T x ) = 1 1 + e − ( θ T x )
- Logistic 回归的损失函数这里采用交叉熵,此外常见的还有均方误差作为损失函数。它的定义如下:
J(θ)=−1m[∑i=1m(y(i)loghθ(x(i))+(1−y(i))log(1−hθ(x(i)))] J ( θ ) = − 1 m [ ∑ i = 1 m ( y ( i ) log h θ ( x ( i ) ) + ( 1 − y ( i ) ) log ( 1 − h θ ( x ( i ) ) ) ]
- 参数说明
- m:训练样本的个数;
- hθ(x):用参数θ和x预测出来的y值;
- y:原训练样本中的y值,也就是标准答案
- 上角标(i):第i个样本
1.4、多分类应用 — Softmax 回归
1.4.1 Softmax 函数定义以及 Loss Function
- 到目前为止,我们都是针对二分类问题进行处理的,能够得到发生或者不发生的概率 p。当面对多分类时,通常有两种做法,一对多 和 一对所有
- 一对多:就是计算多个模型,每一个类都计算一个 “ 一 vs 所有,(one againt all)的概率
- 一对所有,就是只计算一个概率集合,每个概率表示属于其中某一个类的可能性概率。它对应的就是 Softmax 回归格式,这是对于 Logistic 回归的 n 类的泛化。
- 于是,我们需要将训练样本的标签 label 做出改变从二值标签( ) 到 向量标签( ), 其中 K 是类的数目,y 可以取 K 个不同的值,针对它我们可以对于每个由前面 Sigmoid 函数输出的属于某一个类的概率 X 估算出 P(y = k | x) 的概率,其中 k = 1 … K(即进一步将 Logistic 回归泛化,通过 Softmax 函数对输出的值做归一化为新的概率值)。它的输出将会是一个 K 维的向量,每个数值对应的是它属于当前类的概率。
- 这里假设在进入softmax函数之前,已经有模型输出C值,其中C是要预测的类别数,模型可以是全连接网络的输出a,其输出个数为C,即输出为a1,a2,…,aC。故对每个样本,它属于类别i的概率为:
yi=eai∑Ck=1eak ∀i∈1...C y i = e a i ∑ k = 1 C e a k ∀ i ∈ 1... C
通过上式可以保证 ∑Ci=1yi=1 ∑ i = 1 C y i = 1 , 即属于各个类别的概率和为1。
- 求导数
- 对softmax函数进行求导,即求: ∂yi∂aj ∂ y i ∂ a j ,第i项的输出对第j项输入的偏导。
- 代入softmax函数表达式,可以得到: ∂yi∂aj=∂eai∑Ck=1eak∂aj ∂ y i ∂ a j = ∂ e a i ∑ k = 1 C e a k ∂ a j
- 由求导规则可知:对于 f(x) = g(x) / h(x) 的求导公式为:
f′(x)=g′(x)h(x)−g(x)h′(x)[h(x)]2 f ′ ( x ) = g ′ ( x ) h ( x ) − g ( x ) h ′ ( x ) [ h ( x ) ] 2 - eai e a i (即g(x))对aj进行求导,这里要分情况讨论:
- 如果i=j,则求导结果为 eai e a i
- 如果i≠j,则求导结果为0
- 再来看, ∑Ck=1eak ∑ k = 1 C e a k 对aj求导,结果为 eai e a i 。
- 最后结合上述两者,带入求导公式,
- 当 i=j 时:
- ∂yi∂aj=∂eai∑Ck=1eak∂aj=eaiΣ−eaieajΣ2=eaiΣΣ−eajΣ=yi(1−yj) ∂ y i ∂ a j = ∂ e a i ∑ k = 1 C e a k ∂ a j = e a i Σ − e a i e a j Σ 2 = e a i Σ Σ − e a j Σ = y i ( 1 − y j )
- 当 i≠j 时:
- ∂yi∂aj=∂eai∑Ck=1eak∂aj=0−eaieajΣ2=−eaiΣeajΣ=−yiyj ∂ y i ∂ a j = ∂ e a i ∑ k = 1 C e a k ∂ a j = 0 − e a i e a j Σ 2 = − e a i Σ e a j Σ = − y i y j
- 其中,为了方便,令 Σ = Σ=∑Ck=1eak Σ = ∑ k = 1 C e a k
- 对softmax函数进行求导,即求: ∂yi∂aj ∂ y i ∂ a j ,第i项的输出对第j项输入的偏导。
- 对数似然函数(Loss function)
- 机器学习里面,对模型的训练都是对Loss function进行优化,在分类问题中,我们一般使用最大似然估计(Maximum likelihood estimation)来构造损失函数。对于输入的 x,其对应的类标签为t,我们的目标是找到这样的θ使得p(t|x)最大。在二分类的问题中,我们有:
p(t|x)=(y)t(1−y)1−t p ( t | x ) = ( y ) t ( 1 − y ) 1 − t - 其中,y=f(x)是模型预测的概率值,t是样本对应的类标签。将问题泛化为更一般的情况,多分类问题: (如下)
p(t|x)=∏i=1CP(ti|x)ti=∏i=1Cytii p ( t | x ) = ∏ i = 1 C P ( t i | x ) t i = ∏ i = 1 C y i t i - 由于连乘可能导致最终结果接近0的问题,一般对似然函数取对数的负数,变成最小化对数似然函数。
−log p(t|x)=−log∏i=1Cytii=−∑i=iCtilog(yi) − l o g p ( t | x ) = − l o g ∏ i = 1 C y i t i = − ∑ i = i C t i l o g ( y i )
- 机器学习里面,对模型的训练都是对Loss function进行优化,在分类问题中,我们一般使用最大似然估计(Maximum likelihood estimation)来构造损失函数。对于输入的 x,其对应的类标签为t,我们的目标是找到这样的θ使得p(t|x)最大。在二分类的问题中,我们有:
- 交叉熵
- 经过推理可得,交叉熵和上面的对数似然函数的形式一样 !
- 对一个样本来说,真实类标签分布与模型预测的类标签分布可以用交叉熵来表示:
lCE=−∑i=1Ctilog(yi) l C E = − ∑ i = 1 C t i l o g ( y i )
- Loss function 求导
- 对单个样本来说,loss function lCE l C E 对输入aj的导数为:
∂lCE∂aj=−∑i=1C∂tilog(yi)∂aj=−∑i=1Cti∂log(yi)∂aj=−∑i=1Cti1yi∂yi∂aj ∂ l C E ∂ a j = − ∑ i = 1 C ∂ t i l o g ( y i ) ∂ a j = − ∑ i = 1 C t i ∂ l o g ( y i ) ∂ a j = − ∑ i = 1 C t i 1 y i ∂ y i ∂ a j
- 在文章上面已经计算出了, ∂yi∂aj ∂ y i ∂ a j 的求导结果,将其带入上面的式子,便可得到:
−∑i=1Cti1yi∂yi∂aj=−tiyi∂yi∂ai−∑i≠jCtiyi∂yi∂aj=−tjyiyi(1−yj)−∑i≠jCtiyi(−yiyj)=−tj+tjyj+∑i≠jCtiyj=−tj+∑i=1Ctiyj=−tj+yj∑i=1Cti=yj−tj − ∑ i = 1 C t i 1 y i ∂ y i ∂ a j = − t i y i ∂ y i ∂ a i − ∑ i ≠ j C t i y i ∂ y i ∂ a j = − t j y i y i ( 1 − y j ) − ∑ i ≠ j C t i y i ( − y i y j ) = − t j + t j y j + ∑ i ≠ j C t i y j = − t j + ∑ i = 1 C t i y j = − t j + y j ∑ i = 1 C t i = y j − t j
- 对单个样本来说,loss function lCE l C E 对输入aj的导数为:
1.4.2 其他相关的 Softmax 回归的一些操作
- 其一 :正则化,正如之前提到的逻辑回归使用的梯度下降方法来最小化损失函数,但是该方法对特征数据的分布和形式非常敏感。因此,我们一般都会对数据进行预处理,以期待获得更好、更快的收敛结果。其实,数据正则化就相当平滑误差表面,使得梯度下降迭代更快地收敛到最小误差。
- 其二 :one-hot编码,此外,我们在做 Softmax 编码的时候,可能会使用 one-hot 编码。它将一个表示类的数值,转变成一个阵列,而原表示类数值的列表编码后成为矩阵列表。对应某一列的某一个类别,为1,其他都为0,用法可以参见 tf.ont_hot API
- 下面插播一条广告:
- Tensoflow 中的 skflow发布的目的就是以模拟 sklearn 的接口运行 TensorFlow,这样会比 TensorFlow 的会话环境中运行简化掉很多工作。他是抽象上层API接口,提供了完全类似于sklearn的API接口。使用非常简单,只要有sklearn的使用经验,构建一个模型就是简单几个步骤,模型参数配置,fit,predict等等。它已经被完全整合到了 TensorFlow 框架中了。后面也会给出代码实例。
二、TensorFlow 代码区实践
2.1 单变量 Logistic 回归
%matplotlib inline
import pandas as pd
import numpy as np
import matplotlib as mpl
import matplotlib.pyplot as plt
import tensorflow as tf

data = pd.read_csv('CHD.csv',header=0)
print data.describe()   # 根据这个统计,我们可对下列的坐标 x,y 进行相应的调整
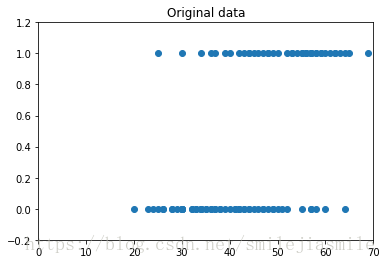
# 原始数据
plt.figure()      # Create a new figure
# 坐标轴 x 从 0 ~ 70,y 从 -0.2 ~ 1.2
plt.axis([0,70,-0.2,1.2])
plt.title('Original data')
plt.scatter(data['age'],data['chd'])

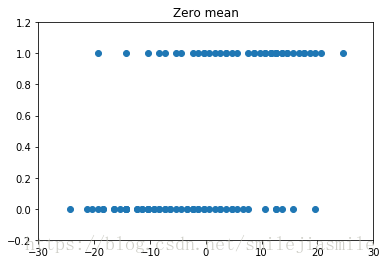
# 数据中心零均值处理
plt.figure()
plt.axis([-30,30,-0.2,1.2])
plt.title('Zero mean')
plt.scatter(data['age'] - 44.38,data['chd'])

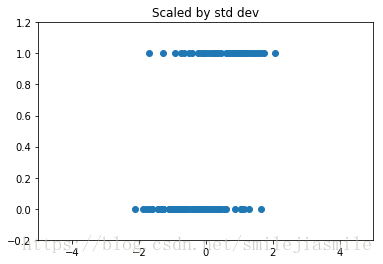
plt.figure()
plt.axis([-5,5,-0.2,1.2])
plt.title('Scaled by std dev')
plt.scatter((data['age']-44.8)/11.7,data['chd'])

print '\n',(data['age']/11.721327).describe()
age chd
count 100.000000 100.00000
mean 44.380000 0.43000
std 11.721327 0.49757
min 20.000000 0.00000
25% 34.750000 0.00000
50% 44.000000 0.00000
75% 55.000000 1.00000
max 69.000000 1.00000
# Parameters
learning_rate = 0.2
# 将训练数据分为 5个训练迭代循环,即 5 个 epochs,一个 epoch 大小为199,batch
training_epochs = 5
batch_size = 100
display_step = 1 # 每几个 epoch 画一次图
sess = tf.Session()
b = np.zeros((100,2))    # 100 行 2 列,全 0
# one-hot 编码,这里只是先用来说明一下 tf.one_hat 的使用方法
print '列表 [1,3,2,4] 的 one-hot 编码为: \n\n',sess.run(tf.one_hot(indices=[1,3,2,4],depth=5,on_value= 1,off_value=0,axis=1,name='a'))
列表 [1,3,2,4] 的 one-hot 编码为:
[[0 1 0 0 0]
[0 0 0 1 0]
[0 0 1 0 0]
[0 0 0 0 1]]
# tf Graph Input
x = tf.placeholder('float',[None,1])    # 数据的第一列, Placeholder for the 1D data, 前面的 None 可以根据后面 Feed 自适应
y = tf.placeholder('float',[None,2])    # 数据的第二列, Placeholder for the classes {2}
# Create model
# Set model weights  这里我们为数据流图创建初识变量和占位符。x, y 都为浮点变量
W = tf.Variable(tf.zeros([1,2]))    # [[0],[0]]
b = tf.Variable(tf.zeros([2]))      #   [0,0]
# Construct model
# 注意:tf.nn :提供神经网络相关操作的支持,包括卷积操作(conv)、池化操作(pooling)、
# 归一化、loss、分类操作、embedding、RNN、Evaluation。等
# tf.layers:主要提供的高层的神经网络,主要和卷积相关的,是对tf.nn的进一步封装,tf.nn会更底层一些。
# 我们创建激活函数,并且将其作用于线性方程之上
activation = tf.nn.softmax(tf.matmul(x,W) + b)
# Minimize erroe using cross entropy
# 我们选择交叉熵作为损失函数,定义有优化器操作,选择梯度下降算法。
cost = tf.reduce_mean(-tf.reduce_sum(y*tf.log(activation),reduction_indices=1)) # Cross entropy
optimizer = tf.train.GradientDescentOptimizer(learning_rate).minimize(cost) # Gradient Descent # Initializeing the variables
init = tf.global_variables_initializer()# Launch the graph
with tf.Session() as sess:
tf.train.write_graph(sess.graph,'/Users/duzhe/Downloads/chen/Jupter-notebook/VSCODE_tensorflow/My_pratise/graph/Logist_one/','graph.pbtxt')
sess.run(init)
writer = tf.summary.FileWriter('/Users/duzhe/Downloads/chen/Jupter-notebook/VSCODE_tensorflow/My_pratise/graph/Logist_one/',sess.graph)
# Initialize the drawing graph structure
graphnumber = 321
# Generate a new graph
plt.figure(1)
# Iterate through all the epochs
for epoch in range(training_epochs):
avg_cost = 0.
total_batch = 400 / batch_size
# Loop over all batches
for i in range(total_batch):
# Transform the array into a one hot format
# 由 API 可知 因为 axis = -1,故shape 为 features x depth
# 此外 deep 一般选择 indices 加一
temp = tf.one_hot(indices=data['chd'], depth=2, on_value = 1, off_value = 0, axis = -1 , name = "a")
# 由此说明 前面站位符处定义的 shape 和 Feed 的 shape 要保持一样才行
# batch_xs, batch_ys = (data['age'].T - 44.38) / 11.721327, temp
batch_xs, batch_ys = (np.transpose([data['age']]) - 44.38) / 11.721327, temp
# Fit training using batch data
sess.run(optimizer,feed_dict={x: batch_xs.astype(float),y: batch_ys.eval()})
# Compute average loss, suming the corrent cost divided by the batch total number
avg_cost += sess.run(cost,feed_dict={x: batch_xs.astype(float),y: batch_ys.eval()})
# Display logs per epoch step
if epoch % display_step == 0:
print 'Epoch:', '%05d'%(epoch + 1), 'cost=',"{:.8f}".format(avg_cost)
# Generate a new graph, and add it to the complete graph
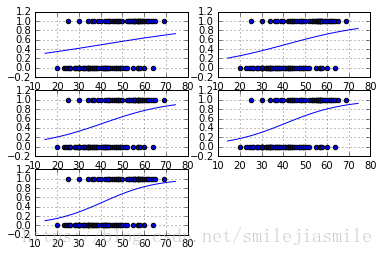
trX = np.linspace(-30, 30, 100)
print b.eval()
print W.eval()
Wdos = 2*W.eval()[0][0] / 11.721327
bdos = 2* b.eval()[0]
# Cenerate the probability function (即广义化了的 Sigmoid 函数)
trY = np.exp(-(Wdos*trX)+bdos)/(1+np.exp(-(Wdos*trX)+bdos))
# Draw the samples and the probability function, whithout the normalization
plt.subplots(graphnumber)
graphnumber = graphnumber + 1
#Plot a scatter draw of the random datapoints
plt.scatter(data['age'],data['chd'])
plt.plot(trX+44.38,trY) # Plot a scatter draw of the random datapoints
plt.grid(True)
# Plot the final graph
plt.savefig('test.svg')Epoch: 00001 cost= 0.66692954
[ 0.014 -0.014]
[[-0.05061885 0.05061885]]
Epoch: 00001 cost= 1.31255966
[ 0.02660366 -0.02660367]
[[-0.09623589 0.09623589]]
···· 此处省略部分结果
2.2 基于 skflow 的单变量逻辑回归
- 在本例中我们将学习如何生成一个具体的非常有组织的回归模型。
import numpy as np
import pandas as pd
import tensorflow.contrib.learn as skflow
from sklearn import datasets, metrics, preprocessing

# Read data
data = pd.read_csv('./CHD.csv',header=0)
print data.describe()
age chd
count 100.000000 100.00000
mean 44.380000 0.43000
std 11.721327 0.49757
min 20.000000 0.00000
25% 34.750000 0.00000
50% 44.000000 0.00000
75% 55.000000 1.00000
max 69.000000 1.00000
# 像 sklearn 一样定义模型
def my_model(X,y):
    return skflow.models.logistic_regression(X,y)

# 正则化 scaler
scaler = preprocessing.StandardScaler()

X = scaler.fit_transform([data['age'].astype(float)])
print scaler.get_params()b
{'copy': True, 'with_mean': True, 'with_std': True}
age = tf.feature_column.numeric_column('age')

# 建立自己的估计量
classifier = skflow.Estimator(model_fn=my_model,model_dir='/Users/duzhe/Downloads/chen/Jupter-notebook/VSCODE_tensorflow/My_pratise/skflow/Logistic/')
classifier.fit(X,data['chd'].astype(float))
print classifier.get_tensor_value('logistic_regression/bias:0')
print(classifier.get_tensor_value('logistic_regression/weight:0'))
score = metrics.accuracy_score(data['chd'].astype(float),classifier.predict(X))
print ('Accuracy: %f' % score)
2.3 基于 keras 的单变量逻辑回归
import tensorflow as tf
import numpy as np
import pandas as pd
from keras.models import Sequential
from keras.layers import Dense
from sklearn import datasets, metrics,preprocessing
from sklearn.utils import shuffle

# Load the dataset
data = pd.read_csv('./CHD.csv',header=0)
print data.describe()

# Normalize the input data
scaler = preprocessing.StandardScaler()
# print data['age'].shape,type(data['age'])
# print data['age'].reshape(-1,1).shape, type(data['age'].reshape(-1,1))

# 将 Series 转化为 numpy  (100, 1)
X = scaler.fit_transform(data['age'].reshape(-1,1))

# Shuffle the data
x, y = shuffle(X, data['chd'])

# Define the model as a logistic regression with
model = Sequential()
# 在这里我们的输出是 1 个 units ,输入特征是一个维度
model.add(Dense(1,activation='sigmoid',input_dim=1))
# 这里我们选用 rmsprop 优化方法,loss 选用 交叉熵
model.compile(optimizer='rmsprop',loss='binary_crossentropy')

# Fit the model with the first 90 elements, and spliting 70% /30% of them for training/validation set.
# verbose:日志显示,0为不在标准输出流输出日志信息,1为输出进度条记录,2为每个epoch输出一行记录
# epochs:整数,训练终止时的epoch值,训练将在达到该epoch值时停止
model.fit(x[:90],y[:90],nb_epoch=100,validation_split=0.33,shuffle=True,verbose=2)

# Evaluate the model with the last 10 elements
score = model.evaluate(x[90:],y[90:],verbose=2)
print model.metrics_names
print score
age chd
count 100.000000 100.00000
mean 44.380000 0.43000
std 11.721327 0.49757
min 20.000000 0.00000
25% 34.750000 0.00000
50% 44.000000 0.00000
75% 55.000000 1.00000
max 69.000000 1.00000
Train on 60 samples, validate on 30 samples
Epoch 1/100
- 0s - loss: 1.1083 - val_loss: 0.9735
Epoch 2/100
- 0s - loss: 1.1058 - val_loss: 0.9721
Epoch 3/100
- 0s - loss: 1.1040 - val_loss: 0.9710
Epoch 4/100
- 0s - loss: 1.1027 - val_loss: 0.9701
Epoch 5/100
- 0s - loss: 1.1012 - val_loss: 0.9691
···· 此处省略部分结果
 - 0s - loss: 1.0101 - val_loss: 0.9033
Epoch 100/100
 - 0s - loss: 1.0092 - val_loss: 0.9026
['loss']
1.1765038967132568
注:本文参考文献有(非常感谢下面这些优秀的博主,让我学到了很多): https://blog.csdn.net/behamcheung/article/details/71911133
