《Hands On Machine Learning with Scikit-Learn and TensorFlow》读书笔记(1)
今天开始记录一下《Hands On Machine Learning with Scikit-Learn and TensorFlow》的内容要点。
数据下载
导入必要的Python包,下载本书的数据。
import os
import tarfile
from six.moves import urllib
DOWNLOAD_ROOT = "https://raw.githubusercontent.com/ageron/handson-ml/master/"
HOUSING_PATH = "./datasets/housing"
HOUSING_URL = DOWNLOAD_ROOT + HOUSING_PATH + "/housing.tgz"
def fetch_housing_data(housing_url=HOUSING_URL, housing_path=HOUSING_PATH):
    if not os.path.isdir(housing_path):
        os.makedirs(housing_path)
    tgz_path = os.path.join(housing_path, "housing.tgz")
    urllib.request.urlretrieve(housing_url, tgz_path)
    housing_tgz = tarfile.open(tgz_path)
    housing_tgz.extractall(path=housing_path)
    housing_tgz.close()
调用函数来进行数据的下载。
fetch_housing_data()数据分析
1.导入数据
利用pandas包将数据转换成DataFrame的格式,便于下面进行处理。
import  pandas as pd
def load_housing_data(housing_path=HOUSING_PATH):
    csv_path=os.path.join(housing_path,"housing.csv")
    return pd.read_csv(csv_path)
housing=load_housing_data()
2.数据的初步了解
对数据要有一个初步的了解,可以利用库函数进行下列操作。
housing.head()
从结果中可以了解数据的属性,以及前几行数据的基本格式。
housing.info()
这个函数的结果显示的是数据的一些基本信息和各个属性的基本类型:
1. 大部分数据是float型,最后一个数据是非数字的数据。
2. 数据共有20640行,其中total_bedrooms有NaN数据。
3. 最后一行显示数据占用的内存。
数据的最后一个字段ocean_proximity是非数值型的数据,可以查看每一个类别都有多少取值。
housing["ocean_proximity"].value_counts()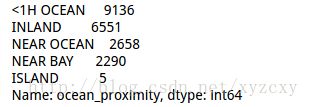
可以看到,这个字段有五个不同的取值,后面的数字代表每个取值的个数。
对于数值类型的字段可以计算均值,标注差,百分位数等统计值。
housing.describe()
需要注意:非数值型的字段不能计算统计值,即本文中的ocean_proximity字段没有上述指标。
3.数据的可视化
导入matplotlib包,对数据进行可视化。在Jupyter notebook中要加入代码中的第一行。
%matplotlib inline
import matplotlib.pyplot as plt
housing.hist(bins=50,figsize=(20,15))
plt.show()
由此可以对各个字段的数值分布有一个基本的了解。
数据集的切分
在利用机器学习算法进行训练时,需要先进行数据的切分,将数据划分为训练集和测试集。
随机抽样
import numpy as np
def split_train_test(data,test_ratio):
    shuffled_indices=np.random.permutation(len(data))
    test_set_size=int(len(data)*test_ratio)
    test_indices=shuffled_indices[:test_set_size]
    train_indices=shuffled_indices[test_set_size:]
    return data.iloc[train_indices],data.iloc[test_indices]
train_set,test_set=split_train_test(housing,0.2)
print len(train_set),"train+",len(test_set),"test"
随机选择一定比例的数据当做训练集,另一部分留作测试。但是每次运行程序都会生成不同的训练集和测试集,就会导致算法实际上是在所有数据上训练出来的。
为了避免这个问题,可以将随机数种子固定,但是一旦更新了数据,如增加新的数据,也不能保证这个方法有效。
这里介绍一个利用hash的方法进行数据鉴别,即在训练集中的数据,随着数据的更新,也不会出现在测试集中。
import hashlib
def test_set_check(identifier,test_ratio,hash):
    return hash(np.int64(identifier)).digest()[-1]<256*test_ratio
def split_train_test_by_id(data,test_ratio,id_column,hash=hashlib.md5):
    ids=data[id_column]
    in_test_set=ids.apply(lambda id_:test_set_check(id_,test_ratio,hash))
    return data.loc[~in_test_set],data.loc[in_test_set]
将数据的某一个字段进行处理,根据此字段的取值生成hash值,当做这条数据的身份鉴别。
housing_with_id=housing.reset_index()
train_set,test_set=split_train_test_by_id(housing_with_id,0.2,"index")
这里重新产生每一条数据新的索引,然后根据索引产生数据的hash值,再进行数据划分。
sklearn中有封装好的函数进行数据集的切分。
from sklearn.model_selection import train_test_split
train_set,test_set=train_test_split(housing,test_size=0.2,random_state=42)#42可以设置成不同的值
分层抽样
如果仅仅进行随机划分,可能使学习到的算法有偏差。例如:如果在某一个数据中,男女比例为7:3,并且性别对于预测结果非常重要。如果随机划分数据集,不能保证训练集中的男女比例和总数据集一致。所以要分层采样。
在本书使用的预测房价的数据中,假设median_income字段对于结果非常重要,要根据此字段进行分层采样。
housing["income_cat"]=np.ceil(housing["median_income"]/1.5)
housing["income_cat"].where(housing["income_cat"]<5,5.0,inplace=True)
这里除以1.5仅仅是将类别数目减少,无特殊含义。将结果大于5的数据都归为最后一类,这样将连续数据变成了5类。然后分层采样。
from sklearn.model_selection import StratifiedShuffleSplit
split=StratifiedShuffleSplit(n_splits=1,test_size=0.2,random_state=42)
for train_index,test_index in split.split(housing,housing["income_cat"]):
    strat_train_set=housing.loc[train_index]
    strat_test_set=housing.loc[test_index]
导入分层采样所需要的函数,生成对象,这里n_splits代表划分的次数,test_size代表测试集比例。
下面进行验证,看比例是否相同。
housing["income_cat"].value_counts()/len(housing)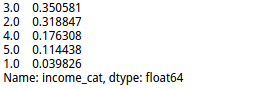
strat_train_set["income_cat"].value_counts()/len(strat_train_set)
可以看出,各个取值的比例基本一致。
下面删除用来划分数据集的字段。
for set in (strat_train_set,strat_test_set):
    set.drop(["income_cat"],axis=1,inplace=True)