线性回归模型实例
import tensorflow as tf
import numpy as np
import matplotlib.pyplot as plt


# 模拟数据
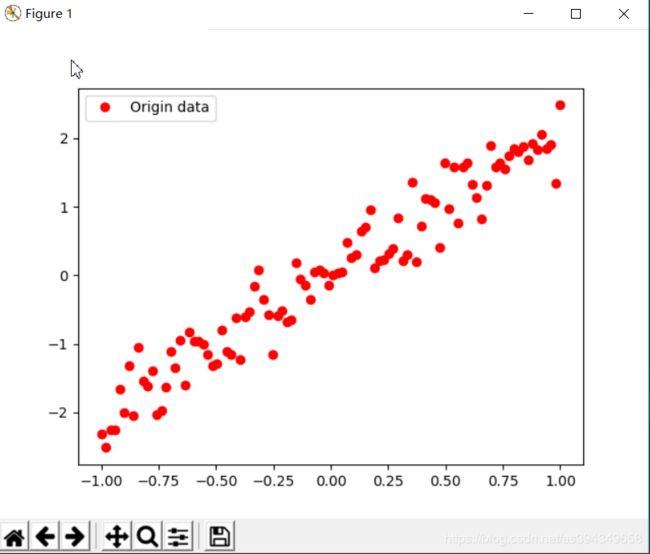
train_X = np.linspace(-1, 1, 100)
train_Y = 2 * train_X + np.random.randn(* train_X.shape) * 0.3
plt.plot(train_X, train_Y, 'ro', label='Origin data')
plt.legend()
plt.show()
tf.reset_default_graph()

# 创建模型
X = tf.placeholder("float")
Y = tf.placeholder("float")
W = tf.Variable(tf.random_normal([1]), name="weight")
b = tf.Variable(tf.zeros([1]), name="bias")
z = tf.multiply(X, W) + b
tf.summary.histogram('z', z)   # 将预测值以直方图形式显示

# 反向优化
cost = tf.reduce_mean(tf.square(Y-z))
tf.summary.scalar('loss_function', cost)  # 将损失值以标量形式显示
learning_rate = 0.01
optimizer = tf.train.GradientDescentOptimizer(learning_rate).minimize(cost)  # 梯度下降函数

# 初始化所有变量
init = tf.global_variables_initializer()
# 定义参数
training_epochs = 20
display_step = 2

saver = tf.train.Saver(max_to_keep=1)  # 生成saver
savedir = "log/"  # 生成模型的目录

# 启动session
with tf.Session() as sess:
    sess.run(init)
    plotdata = {"batchsize": [], "loss": []}

    merged_summary_op = tf.summary.merge_all()   # 合并所有summary
    # 创建summary_write,用于写文件
    summary_write = tf.summary.FileWriter('log/mnist_with_summaries', sess.graph)


    def moving_average(a, w=10):
        if len(a) < w:
            return a[:]
        return [val if idx < w else sum(a[(idx-w):idx])/w for idx, val in enumerate(a)]

    # 向模型输入数据
    for epoch in range(training_epochs):
        for (x, y) in zip(train_X, train_Y):
            sess.run(optimizer, feed_dict={X: x, Y: y})

        # 生成summary
        summary_str = sess.run(merged_summary_op, feed_dict={X: x, Y: y})
        summary_write.add_summary(summary_str, epoch)   # 将summary写入文件
        if epoch % display_step == 0:
            loss = sess.run(cost, feed_dict={X: train_X, Y: train_Y})
            print("Epoch:", epoch+1, "cost=", loss, "W=", sess.run(W), "b=", sess.run(b))
            if not(loss == "NA"):
                plotdata["batchsize"].append(epoch)
                plotdata["loss"].append(loss)
            saver.save(sess, savedir + "linermodel.cpkt", global_step=epoch)
    print("Finished!")
    print("cost=", sess.run(cost, feed_dict={X: train_X, Y: train_Y}), "W=", sess.run(W), "b=", sess.run(b))

# 图形显示
    plt.plot(train_X, train_Y, 'go', label='Original data')
    plt.plot(train_X, sess.run(W)*train_X+sess.run(b), label='Fittendline')
    plt.legend()
    plt.show()
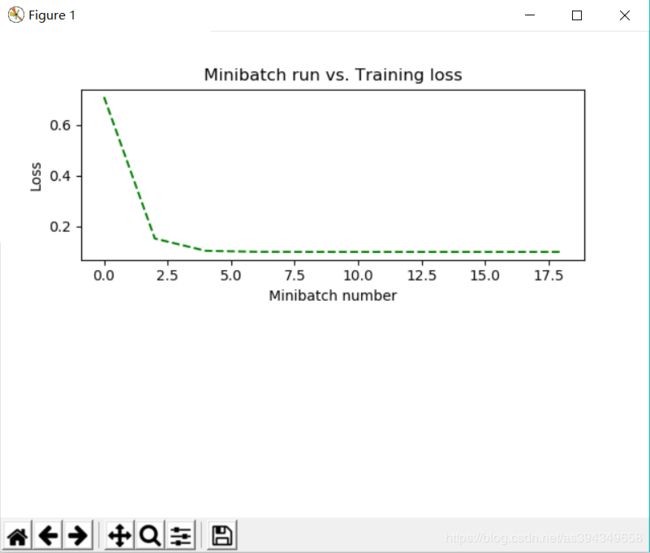
    plotdata["avgloss"] = moving_average(plotdata["loss"])
    plt.figure(1)
    plt.subplot(211)
    plt.plot(plotdata["batchsize"], plotdata["avgloss"], 'g--')
    plt.xlabel("Minibatch number")
    plt.ylabel("Loss")
    plt.title("Minibatch run vs. Training loss")
    plt.show()
    print("x=0.5, z=", sess.run(z, feed_dict={X: 0.5}))
随机生成的数据

预测

损失函数

输出
Epoch: 1 cost= 0.7104493 W= [0.8864649] b= [0.37693274]
Epoch: 3 cost= 0.1526902 W= [1.7508404] b= [0.14930516]
Epoch: 5 cost= 0.104392506 W= [1.9856626] b= [0.06094472]
Epoch: 7 cost= 0.10053254 W= [2.0465708] b= [0.037601]
Epoch: 9 cost= 0.10012227 W= [2.062323] b= [0.03155661]
Epoch: 11 cost= 0.100055546 W= [2.066395] b= [0.02999388]
Epoch: 13 cost= 0.100040905 W= [2.067449] b= [0.0295895]
Epoch: 15 cost= 0.10003729 W= [2.067722] b= [0.02948488]
Epoch: 17 cost= 0.100036375 W= [2.0677924] b= [0.02945776]
Epoch: 19 cost= 0.10003612 W= [2.067811] b= [0.02945062]
Finished!
cost= 0.10003611 W= [2.067813] b= [0.02944985]
x=0.5, z= [1.0633563]

Process finished with exit code 0


