Python机器学习及实践——进阶篇3(模型正则化之欠拟合与过拟合)
一个需要记住的重要事项:任何机器学习模型在训练集上的性能表现,都不能作为其对未知测试数据预测能力的评估。
这里讲详细及时什么是模型的泛化力以及如何保证模型的泛化力,一次会阐述模型复杂度与泛化力的关系以及使用L1范数正则化与L2范数正则化加强模型的泛化力,避免模型参数过拟合。
所谓拟合,是指机器学习模型在训练的过程中,通过更新参数,使得模型不断契合训练集的过程。本篇将使用一个“比萨饼价格预测“的例子来说明。
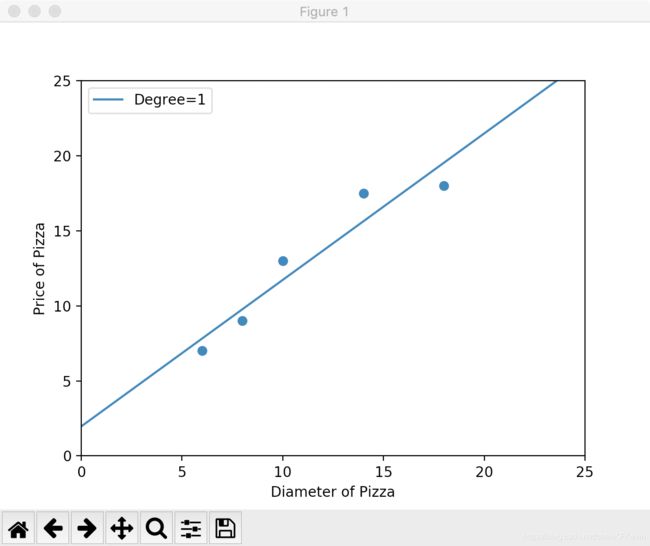
如下图一所示,美国一家比萨饼店出售不同尺寸的比萨,其中每种直径都对应一个报价,我们所要做的就是设计一个学习模型,可以有效地根据图2中比萨的直径特征来预测售价。
目前已知有5组训练数据、4组测试数据,并且其中测试数据的比萨报价未知。根据我们的经验,如果只考虑比萨的尺寸与售价的关系,那么使用线性回归模型比较直观,如代码1所示:
# 输入训练样本的特征以及目标值,分别存储在变量X_train与y_train之中。
X_train = [[6], [8], [10], [14], [18]]
y_train = [[7], [9], [13], [17.5], [18]]

# 从sklearn.linear_model中导入LinearRegression。
from sklearn.linear_model import LinearRegression
# 使用默认配置初始化线性回归模型。
regressor = LinearRegression()
# 直接以披萨的直径作为特征训练模型。
regressor.fit(X_train, y_train)

# 导入numpy并且重命名为np。
import numpy as np
# 在x轴上从0至25均匀采样100个数据点。
xx = np.linspace(0, 26, 100)
xx = xx.reshape(xx.shape[0], 1)
# 以上述100个数据点作为基准,预测回归直线。
yy = regressor.predict(xx)

# 对回归预测到的直线进行作图。
import matplotlib.pyplot as plt
plt.scatter(X_train, y_train)
plt1, = plt.plot(xx, yy, label="Degree=1")
plt.axis([0, 25, 0, 25])
plt.xlabel('Diameter of Pizza')
plt.ylabel('Price of Pizza')
plt.legend(handles = [plt1])
plt.show()

# 输出线性回归模型在训练样本上的R-squared值。
print 'The R-squared value of Linear Regressor performing on the training data is', regressor.score(X_train, y_train)
The R-squared value of Linear Regressor performing on the training data is 0.910001596424
根据代码输出的图,以及当前模型在训练集上的表现(R-squared值为0.9100),我们进一步猜测,也许比萨饼的面积与售价的线性关系更加明显。因此我们试图将远特征升高一个维度,使用(2次)多项式回归对训练样本进行拟合,如代码2所示:
# 从sklearn.preproessing中导入多项式特征产生器
from sklearn.preprocessing import PolynomialFeatures
# 使用PolynominalFeatures(degree=2)映射出2次多项式特征,存储在变量X_train_poly2中。
poly2 = PolynomialFeatures(degree=2)
X_train_poly2 = poly2.fit_transform(X_train)

# 以线性回归器为基础,初始化回归模型。尽管特征的维度有提升,但是模型基础仍然是线性模型。
regressor_poly2 = LinearRegression()

# 对2次多项式回归模型进行训练。
regressor_poly2.fit(X_train_poly2, y_train)

# 从新映射绘图用x轴采样数据。
xx_poly2 = poly2.transform(xx)

# 使用2次多项式回归模型对应x轴采样数据进行回归预测。
yy_poly2 = regressor_poly2.predict(xx_poly2)

# 分别对训练数据点、线性回归直线、2次多项式回归曲线进行作图。
plt.scatter(X_train, y_train)

plt1, = plt.plot(xx, yy, label='Degree=1')
plt2, = plt.plot(xx, yy_poly2, label='Degree=2')

plt.axis([0, 25, 0, 25])
plt.xlabel('Diameter of Pizza')
plt.ylabel('Price of Pizza')
plt.legend(handles = [plt1, plt2])
plt.show()

# 输出2次多项式回归模型在训练样本上的R-squared值。
print 'The R-squared value of Polynominal Regressor (Degree=2) performing on the training data is', regressor_poly2.score(X_train_poly2, y_train)
The R-squared value of Polynominal Regressor (Degree=2) performing on the training data is 0.98164216396
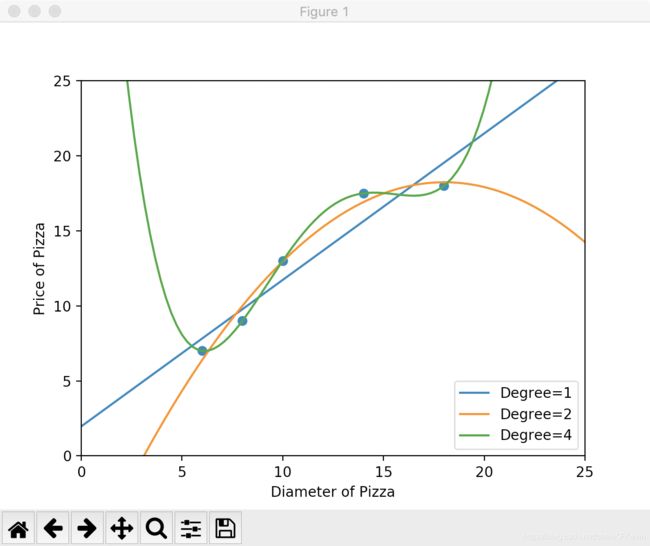
果然升高了特征维度之后,模型在训练样本上的性能表现更加突出,R-squared值从0.910上升至0.982。并且根据输出的图所示,2次多项式回归曲线比起线性回归直线,对训练数据的拟合程度增加了许多,由此我们更加大胆地升高特征维度,如代码3所示,增加到4次多项式。
# 从sklearn.preprocessing导入多项式特征生成器。
from sklearn.preprocessing import PolynomialFeatures
# 初始化4次多项式特征生成器。
poly4 = PolynomialFeatures(degree=4)

X_train_poly4 = poly4.fit_transform(X_train)

# 使用默认配置初始化4次多项式回归器。
regressor_poly4 = LinearRegression()
# 对4次多项式回归模型进行训练。
regressor_poly4.fit(X_train_poly4, y_train)

# 从新映射绘图用x轴采样数据。
xx_poly4 = poly4.transform(xx)
# 使用4次多项式回归模型对应x轴采样数据进行回归预测。
yy_poly4 = regressor_poly4.predict(xx_poly4)

# 分别对训练数据点、线性回归直线、2次多项式以及4次多项式回归曲线进行作图。
plt.scatter(X_train, y_train)
plt1, = plt.plot(xx, yy, label='Degree=1')
plt2, = plt.plot(xx, yy_poly2, label='Degree=2')

plt4, = plt.plot(xx, yy_poly4, label='Degree=4')
plt.axis([0, 25, 0, 25])
plt.xlabel('Diameter of Pizza')
plt.ylabel('Price of Pizza')
plt.legend(handles = [plt1, plt2, plt4])
plt.show()

print 'The R-squared value of Polynominal Regressor (Degree=4) performing on the training data is',regressor_poly4.score(X_train_poly4, y_train)
The R-squared value of Polynominal Regressor (Degree=4) performing on the training data is 1.0
如图所示,4次多项式曲线几乎完全拟合了所有的训练数据点,对应的R-squared值也为1.0,但是如果这时觉得已经找到了完美的模型,就高兴过早了。
下图揭示了比萨的真实价格。
| Testing Instance | Diameter(in inches) | Price(in U.S. dollars) |
| 1 | 6 | 8 |
| 2 | 8 | 12 |
| 3 | 11 | 15 |
| 4 | 16 | 18 |
# 准备测试数据。
X_test = [[6], [8], [11], [16]]
y_test = [[8], [12], [15], [18]]

# 使用测试数据对线性回归模型的性能进行评估。
regressor.score(X_test, y_test)

0.80972683246686095

# 使用测试数据对2次多项式回归模型的性能进行评估。
X_test_poly2 = poly2.transform(X_test)
regressor_poly2.score(X_test_poly2, y_test)

0.86754436563450543

# 使用测试数据对4次多项式回归模型的性能进行评估。
X_test_poly4 = poly4.transform(X_test)
regressor_poly4.score(X_test_poly4, y_test)

0.8095880795781909
如果我们使用代码4评估上述3种模型在测试集上的表现,并将输出对比之前在训练集上的拟合情况,做成图4:结果令人咋舌:当模型复杂度很低时,模型不仅没有对训练集有良好的拟合状态,而且在测试集上也表现平平,这种情况叫欠拟合;但是当我们一味追求很高的模型复杂度,尽管模型几乎完全拟合了所有的训练数据,但模型也变得非常波动,几乎丧失了对未知数据的预测能力,这种情况叫过拟合。这两种情况都是缺乏模型泛化力的表现。
| 特征多项式次数 | 训练集R-squared值 | 测试集R-squared值 |
| Degree=1 | 0.9100 | 0.8097 |
| Degree=2 | 0.9816 | 0.8675 |
| Degree=4 | 1.0000 | 0.8096 |
由此可见,虽然我们不断追求更好的模型泛化力,但是因为未知数据无法预测,所以又期望模型可以充分利用训练数据,避免欠拟合。这就要求在增加模型复杂度、提高在可观测数据上的性能表现的同时,又兼顾模型的泛化力,防止发生过拟合情况。为了平衡这两难的选择,我们通常采用两种模型正则化的方法,分别是L1正则和L2正则。


