在同一张图中画多条折线图,并添加图例
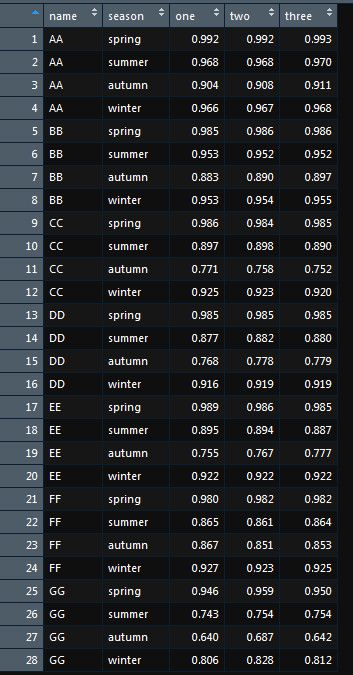
mydata 数据如下图:
#在同一张图中画多条折线图并添加图例
rm(list = ls(all = TRUE))mydata <- read.csv("test.csv",header = TRUE)
spring_data <- mydata[which(mydata$season == "spring"),]
x_names <- as.vector(spring_data$name)
plot(spring_data$one,col = "black",pch = 1,type = "o",xlab = "x",ylab = "y",ylim = c(0.0,1.0), axes = FALSE)
lines(spring_data$two,col = "black",pch = 2,type = "o")
lines(spring_data$three,col = "black",pch = 8,type = "o")
#这里先用axis设置x轴的刻度和标签,其中标签使用空格“ ”来表示,便于后面用text函数自动设置可以旋转角度的x轴刻度
axis(side = 1,at = seq(1,7,by = 1),labels = c(" "," "," "," "," "," "," "))
axis(side = 2,at = seq(0.0,1.0,0.1),labels = seq(0.0,1.0,0.1))
#用text函数自动设置可以旋转角度的x轴刻度
text(x=seq(1,7,by = 1),y = -0.08, srt = 45, adj = 1, labels = x_names,xpd = TRUE)
# #验证x轴刻度是否为1-7
# for(num_i in 1:7)
# {
# abline(v = num_i, col = "green")
# }
summer_data <- mydata[which(mydata$season == "summer"),]
lines(summer_data$one,col = "red",pch = 1,type = "o")
lines(summer_data$two,col = "red",pch = 2,type = "o")
lines(summer_data$three,col = "red",pch = 8,type = "o")
autumn_data <- mydata[which(mydata$season == "autumn"),]
lines(autumn_data$one,col = "magenta",pch = 1,type = "o")
lines(autumn_data$two,col = "magenta",pch = 2,type = "o")
lines(autumn_data$three,col = "magenta",pch = 8,type = "o")
winter_data <- mydata[which(mydata$season == "winter"),]
lines(winter_data$one,col = "blue",pch = 1,type = "o")
lines(winter_data$two,col = "blue",pch = 2,type = "o")
lines(winter_data$three,col = "blue",pch = 8,type = "o")
#加图例
legend(0.85,0.7,c("one", "two", "three"), pt.cex = 1.7, pch = c(1,2,8), cex = 1.3, bty = "n")
legend(0.78,0.4,c("spring", "summer", "autumn", "winter"),
fill = c("black", "red", "magenta", "blue"), border = FALSE,
col = c("black", "red", "magenta", "blue"),pt.cex = 1.7, cex = 1.3, bty = "n")
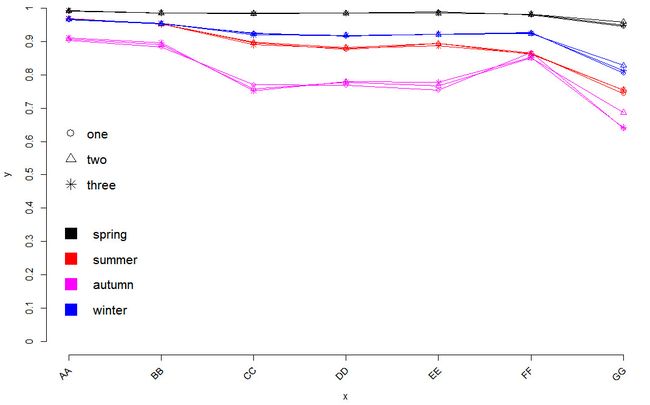
画好的图如下:

