常用Loss总结
1. BCELoss
用于二分类任务,二值交叉熵(Binary Cross Entropy)。
公式如下,其中y是真实值,![]() 是预测值:
是预测值:
![]()
使用方式如下:
class torch.nn.BCELoss


Examples::

        >>> m = nn.Sigmoid()
        >>> loss = nn.BCELoss()
        >>> input = torch.randn(3, requires_grad=True)
        >>> target = torch.empty(3).random_(2)  # 0 或者 1
        >>> output = loss(m(input), target)
        >>> output.backward()
2. CELoss
用于多分类任务,交叉熵(Cross Entropy)。
公式如下,其中y是真实值,![]() 是预测值:
是预测值:
![]()
使用方式如下:
class torch.nn.CrossEntropyLoss


It is useful when training a classification problem with `C` classes.
The `input` is expected to contain scores for each class.

Examples::

        >>> loss = nn.CrossEntropyLoss()
        >>> input = torch.randn(3, 5, requires_grad=True)
        >>> target = torch.empty(3, dtype=torch.long).random_(5)
        >>> output = loss(input, target)
        >>> output.backward()
3. MSELoss
计算均方误差 Mean Squared Error (squared L2 Norm)。
公式如下,其中y是真实值,![]() 是预测值:
是预测值:
class torch.nn.MSELoss

Creates a criterion that measures the mean squared error (squared L2 norm) between
    each element in the input `x` and target `y`.

Examples::

        >>> loss = nn.MSELoss()
        >>> input = torch.randn(3, 5, requires_grad=True)
        >>> target = torch.randn(3, 5)
        >>> output = loss(input, target)
        >>> output.backward()
类别极度不均衡情况
4. FocalLoss
https://www.cnblogs.com/king-lps/p/9497836.html
https://arxiv.org/pdf/1708.02002.pdf
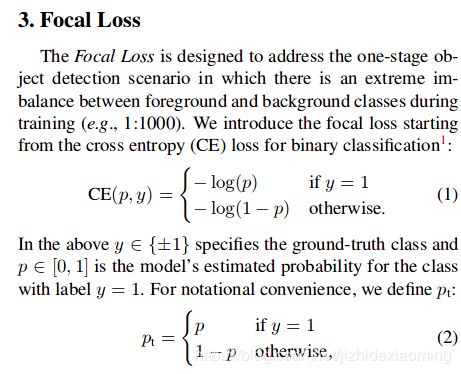
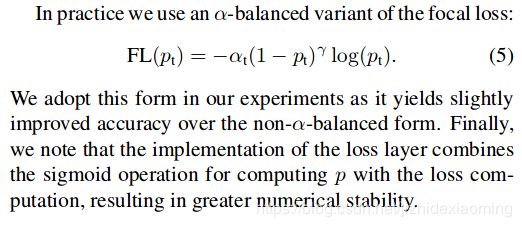
二分类任务,Focal loss主要是为了解决one-stage目标检测中正负样本比例严重失衡的问题。该损失函数降低了大量简单负样本在训练中所占的权重,也可理解为一种困难样本挖掘。
Focal loss 修改自 cross entropy loss for binary classfication (严格来讲是BCE,而不是CE),二值交叉熵:
可见普通的交叉熵对于正样本而言,输出概率越大损失越小。对于负样本而言,输出概率越小则损失越小。
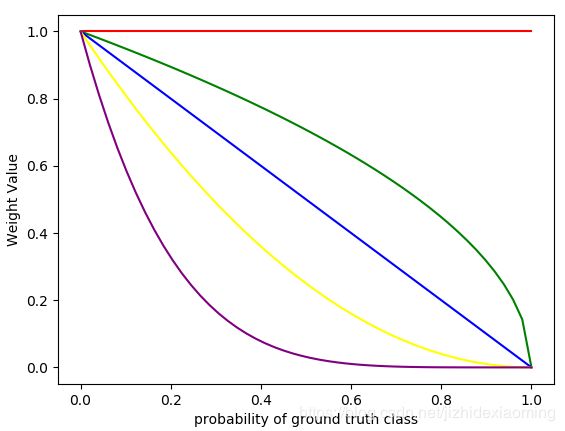
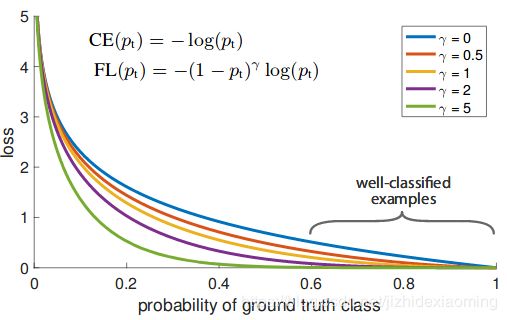
公式4是y = 1时的Focal loss和预测概率p之间关系。其中,gamma=0时,即为二值交叉熵函数。Focal loss只是在原有函数上加个权重,我们可以单独画出y = 1的权重函数图像:
画图所用到的代码:
import numpy as np
import matplotlib.pyplot as plt
x = np.linspace(0, 1)
y1, y2, y3, y4, y5 = (1-x)**0, (1-x)**0.5, (1-x)**1, (1-x)**2, (1-x)**5
plt.plot(x, y1, 'red')
plt.plot(x, y2, 'green')
plt.plot(x, y3, 'blue')
plt.plot(x, y4, 'yellow')
plt.plot(x, y5, 'purple')
# plt.title('line chart')
plt.xlabel('probability of ground truth class')
plt.ylabel('Weight Value')
plt.show()
生成的权重图像:
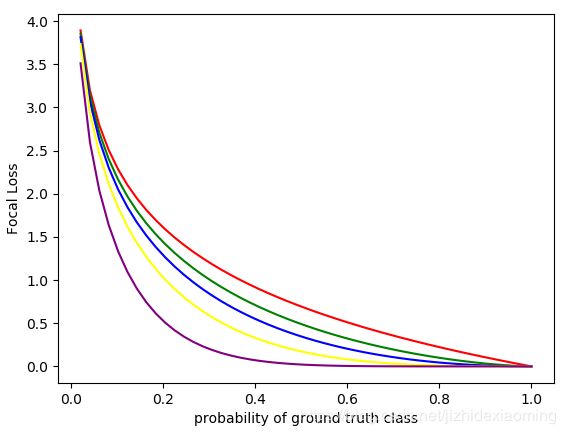
注意:用权重函数,加权BCELoss,则生成论文中的函数图像。由上图可知,其中gamma=2时,权重函数是个单调下降函数,预测的概率值较小时(即为难样本),Focal Loss所加的权重较大,使得整体loss变大,突出难样本;预测值较大时,Focal Loss所加的权重较小(即为易样本),Focal Loss所加的权重较小,使得整体loss变小,这不要紧,因为预测值较大,我们就是希望loss较小。
import numpy as np
import matplotlib.pyplot as plt
x = np.linspace(0, 1)
y1, y2, y3, y4, y5 = (1-x)**0 * (-np.log(x)), (1-x)**0.5 * (-np.log(x)), (1-x)**1 * (-np.log(x)), (1-x)**2 * (-np.log(x)), (1-x)**5 * (-np.log(x))
plt.plot(x, y1, 'red')
plt.plot(x, y2, 'green')
plt.plot(x, y3, 'blue')
plt.plot(x, y4, 'yellow')
plt.plot(x, y5, 'purple')
# plt.title('line chart')
plt.xlabel('probability of ground truth class')
plt.ylabel('Focal loss')
plt.show()
备注:论文中的图像如下
此外,加入平衡因子alpha,用来平衡正负样本本身的比例不均:文中alpha取0.25。用到缺陷检测时,有缺陷的样本非常少,同样可以加入平衡因子alpha。 In practice α may be set by inverse class fre-quency or treated as a hyperparameter to set by cross validation. 即alpha可以设置与样本数成反比,也可以视为一个超参数。
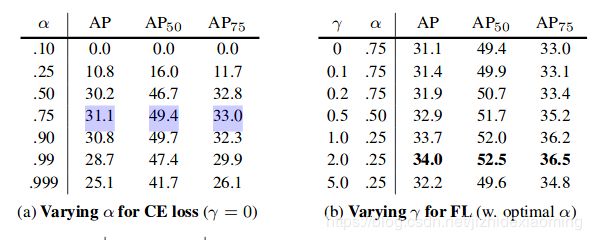
作为正类的有缺陷样本数较少,按照论文的意思应该是alpha大于0.5才对,那是没有![]() 情况下才是这样的,因为Focal Loss受两个调节因子影响,不能但看一个,所以这个参数只是试出来的。
情况下才是这样的,因为Focal Loss受两个调节因子影响,不能但看一个,所以这个参数只是试出来的。
从论文中的实验部分可以得到验证,左边是只有alpha, 没有![]() 加权的,所以apha=0.75时最好。
加权的,所以apha=0.75时最好。
5. DiceLoss
https://www.aiuai.cn/aifarm1159.html
较适用于样本极度不均的情况,公式如下。
后面部分是A和B相似度度量。其中上面分子是矩阵A和B逐个元素相乘,再求和。分母是矩阵分别求和,再相加。对于二分类问题,GT 分割图是只有 0, 1 两个值的,因此 可以有效的将在 Pred 分割图中未在 GT 分割图中激活的所有像素清零,即不管背景像素,只关注要检测的部分. 对于激活的像素,主要是惩罚低置信度的预测,较高值会得到更好的 Dice 系数.
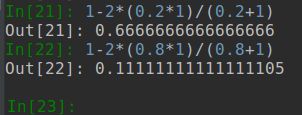
验证结果,预测值为0.2比0.8的loss更大,正好符合:当前类为正类,预测值越小,对应的loss越大。注意diceLoss是不管负类的。
import torch.nn as nn
import torch.nn.functional as F

class SoftDiceLoss(nn.Module):
    def __init__(self, weight=None, size_average=True):
        super(SoftDiceLoss, self).__init__()

    def forward(self, logits, targets):
        num = targets.size(0)
        smooth = 1

        probs = F.sigmoid(logits)
        m1 = probs.view(num, -1)
        m2 = targets.view(num, -1)
        intersection = (m1 * m2)

        score = 2. * (intersection.sum(1) + smooth) / (m1.sum(1) + m2.sum(1) + smooth)
        score = 1 - score.sum() / num
        return score
待续。。。

