机器学习(周志华著)习题 第03章 线性模型
3.1 试析在什么情形下式(3.2)中不必考虑偏置项b
有网友说可以让所有的数据减去第一个样本,但是在实际应用中这样做偶然性太大。可以先对数据进行“中心化”处理,也就是对每一个x 都减去数据集的均值。
3.2 试证明,对于参数 ,对率回归的目标函数(3.18)是非凸的,但其对数似然函数(3.27)是凸的
要想证明(3.18)是非凸的,只需要证明其代表二阶导的Hessian矩阵不是半正定的即可。
由 $$y=\frac{1}{1+e^{w^{T}x+b}}$$ 可得 $$\frac{1}{e^{w^{T}x+b}}=\frac{1}{y}-1$$
一阶导:
$$\frac{\partial y}{\partial w}=\frac{1}{(1+e^{-(w^{T}x+b)})^{2}}\frac{1}{e^{w^{T}x+b}}x=y^{2}(\frac{1}{y}-1)x=(y-y^{2})x$$
二阶导:
$$H=\frac{\partial }{\partial w}(\frac{\partial y}{\partial w})=(1-2y)x(y-y^{2})x^{T}=y(1-2y)(1-y)xx^{T}$$
因为![]() 是半正定的,并且
是半正定的,并且![]() 。当
。当![]() 时
时![]() ,所以此时
,所以此时![]() 是半负定的,显然,式(3.18)是非凸的。
是半负定的,显然,式(3.18)是非凸的。
3.3 编程实现对率回归,并给出西瓜数据集3.0α上的结果
Python代码实现如下:
import numpy as np
import matplotlib.pyplot as plt
import math


DATA = np.array([[0.697, 0.774, 0.634, 0.608, 0.556, 0.403, 0.481, 0.437, 0.666, 0.243, 0.245, 0.343, 0.639, 0.657, 0.360, 0.593, 0.719],
                 [0.460, 0.376, 0.264, 0.318, 0.215, 0.237, 0.149, 0.211, 0.091, 0.267, 0.057, 0.099, 0.161, 0.198, 0.370, 0.042, 0.103]])
LABEL = [1, 1, 1, 1, 1, 1, 1, 1, 0, 0, 0, 0, 0, 0, 0, 0, 0]


def sigmod(z):
    y = 1 / (1+math.exp(z))
    return y


def cost_function(X, label, beta):
    """目标函数值"""
    (m, n) = X.shape
    num = 0
    for i in range(0, n):
        z = np.dot(beta, X[:, i])
        num = num - label[i]*z + np.log(1+np.exp(z))
    return num


def logist_regress(X, label):
    """
    开始用牛顿法求解遇到了一些情况,改成了普通的梯度方法
    :param X: 目标数据集,每一列是一个样本
    :param label: 数据的标签
    :return:
    """
    (m, n) = X.shape
    beta = np.ones((1, m))
    last_value = 0

    # 用牛顿法求解
    # while True:
    #     current_value = cost_function(X, label, beta)
    #     if np.abs(current_value - last_value) < 0.001:
    #         break
    #
    #     last_value = current_value
    #     first_d = np.zeros((1, m))
    #     second_d = np.zeros((m, m))
    #
    #     for i in range(0, n):
    #         z = np.dot(beta, X[:, i])
    #         p1 = np.exp(z) / (1+np.exp(z))
    #         first_d = first_d - X[:, i] * (label[i] - p1)
    #         second_d = second_d + np.outer(X[:, i], np.transpose(X[:, i]))*p1*(1-p1)
    #
    #     print('一阶导是:', first_d)
    #     print('二阶导是,', second_d)
    #     beta = beta - np.dot(np.linalg.inv(second_d), np.transpose(first_d))

    # 用普通的梯度方法求解
    last_value = cost_function(X, label, beta)
    alpha = 0.1
    error_list = []
    index = 0
    while True:
        index = index + 1
        if index > 3000:
            break
        first_d = np.zeros((1, m))
        for i in range(0, n):
            z = np.dot(beta, X[:, i])
            p1 = np.exp(z) / (1+np.exp(z))
            first_d = first_d - X[:, i] * (label[i] - p1)
        beta = beta - alpha * first_d
        current_value = cost_function(X, label, beta)
        error_list.append(current_value)
        if np.abs(last_value - current_value) < 0.01:
            break

    return beta
    # print(beta)
    # print('求解完毕')
    # print(index)
    # plt.plot(error_list)
    # plt.show()


def run():
    (m, n) = DATA.shape
    X = np.ones((m+1, n))
    X[0:m, :] = DATA[:, :]
    beta = logist_regress(X, LABEL)
    print('beta = ', beta)

    for i in range(0, n):
        color = 'c'
        if LABEL[i] == 1:
            color = 'm'
        plt.scatter(DATA[0, i], DATA[1, i], c=color, marker='o')
    x = np.linspace(0, 1, 10)
    y = -beta[0, 0]/beta[0, 1]*x - beta[0, 2]/beta[0, 1]
    plt.plot(x, y)
    plt.title('Logistic Regression')
    plt.show()


if __name__ == '__main__':
    run()
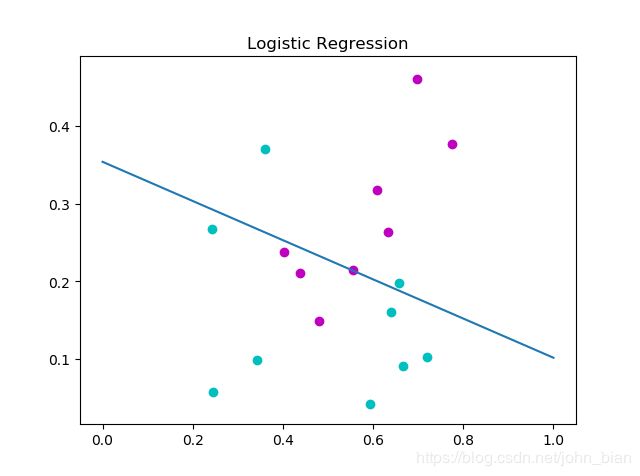
分类结果如下图所示
3.5 编程实现线性判别式分析,并给出西瓜数据集3.0α上的结果
Python实现的代码:
import numpy as np
import matplotlib.pyplot as plt


DATA = np.array([[0.697, 0.774, 0.634, 0.608, 0.556, 0.403, 0.481, 0.437, 0.666, 0.243, 0.245, 0.343, 0.639, 0.657, 0.360, 0.593, 0.719],
                 [0.460, 0.376, 0.264, 0.318, 0.215, 0.237, 0.149, 0.211, 0.091, 0.267, 0.057, 0.099, 0.161, 0.198, 0.370, 0.042, 0.103]])
LABEL = [1, 1, 1, 1, 1, 1, 1, 1, 0, 0, 0, 0, 0, 0, 0, 0, 0]


def lda(X1, X2):
    """
    二分类的LDA
    :param X1: 第一部分数据,每一列是一个样本
    :param X2:
    :return:
    """
    (m1, n1) = X1.shape
    (m2, n2) = X2.shape

    x1_mean = np.mean(X1, axis=1)
    x2_mean = np.mean(X2, axis=1)

    # Sb = np.outer(x1_mean, np.transpose(x2_mean))  # 类间散度
    Sw = np.zeros((m1, m1))  # 类内散度

    for i in range(0, n1):
        Sw = Sw + np.outer(X1[:, i], np.transpose(x1_mean))
    for i in range(0, n2):
        Sw = Sw + np.outer(X2[:, i], np.transpose(x2_mean))

    w = np.dot(np.linalg.inv(Sw), x1_mean-x2_mean)

    return w


def run():
    X1 = DATA[:, 0:8]
    X2 = DATA[:, 8:17]
    w = lda(X1, X2)
    print('w = ', w)

    y1 = np.dot(w, X1)
    y2 = np.dot(w, X2)

    ax1 = plt.subplot(121)
    ax1.scatter(X1[0, :], X1[1, :], c='c', marker='o', label='good')
    ax1.scatter(X2[0, :], X2[1, :], c='m', marker='o', label='bad')
    temp_x = np.linspace(0, 1, 10)
    temp_y = temp_x * (-w[0]/w[1])
    ax1.plot(temp_x, temp_y)
    ax1.legend()
    ax2 = plt.subplot(122)
    ax2.scatter(y1, np.zeros((1, 8)), c='c', marker='o', alpha=0.6, label='good')
    ax2.scatter(y2, np.zeros((1, 9)), c='m', marker='o', alpha=0.6, label='bad')
    ax2.legend()
    # plt.scatter(X1[0, :], X1[1, :], c='c', marker='o')
    # plt.scatter(X2[0, :], X2[1, :], c='m', marker='o')
    plt.show()


if __name__ == '__main__':
    run()
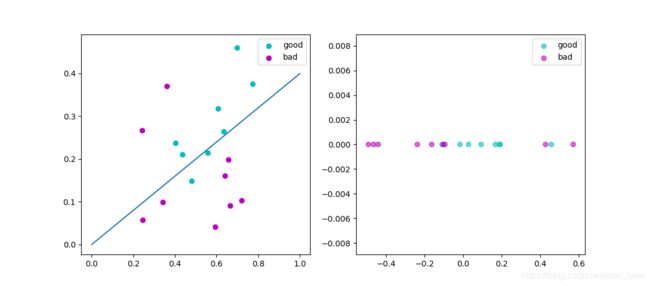
运行结果如下图所示,其中左边是二维的散点图和投影直线,右边是投影之后的一维结果。

