回归模型-线性回归算法
线性回归算法
问题分为有监督问题和无监督问题两类
当用到标签来划分的时候就是有监督问题,当没有用标签值的时候就是无监督问题。
根据工资和年龄来预测出一个具体的值,根据工资和年龄预测出贷款额度
回归和分类是两个问题,分类的话可能得到的结论是是否银行会借钱给你。
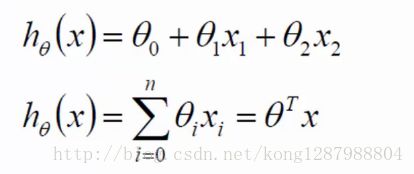
可以把两个特征分别用x1和x2来表示,每个特征的影响程度是不一样的
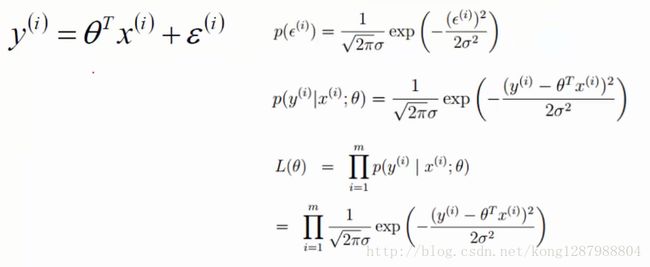
通常我们认为ξ是独立同分布的,同时满足均值为0,方差为theat方的高斯分布。
公式解读:分布p,把公式带入替换ξ,需要求的是p(y|x;theate)表示想要找到这样的theate跟x组合让他越接近y的概率是越大的。
利用似然函数来求解,把所有的概率累成在一起,因为theate是要跟所有的样本都组合。
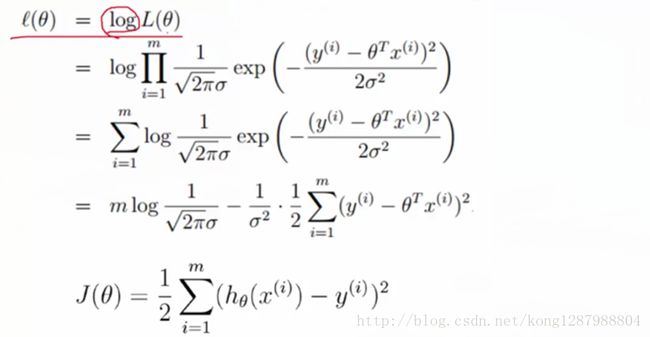
累乘求极值很难,所以开log,因为有公式log(a*b)=loga+logb 所以可以化简,因为前面mlog那项与theate没什么关系,后面的项有个负号,因此要想使得l(theate)最大,j(theate)要取最小值
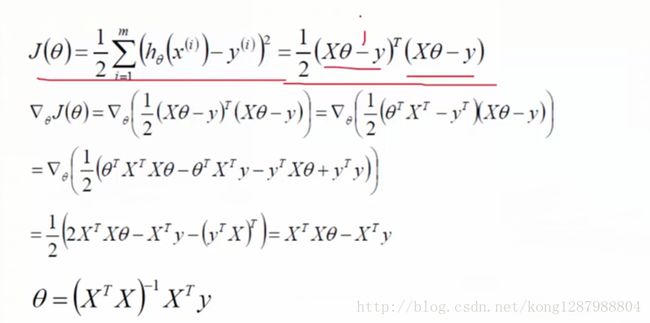
把平方变成转置乘以自身,再求导,最终化简结果
theate=X转置乘X的负一次幂乘以X的转置乘y
Python代码:
import pandas as pd
import matplotlib.pyplot as plt
columns = ["mpg", "cylinders", "displacement", "horsepower", "weight", "acceleration", "model year", "origin", "car name"]
cars = pd.read_table("auto-mpg.data", delim_whitespace=True, names=columns)
print(cars.head(5))
(技巧:使用columes定义字段列表,然后在read_table中使用names=columns引用定义的字段)
在显示了前五行信息之后我们先随机取出两列数据来画图
fig = plt.figure()
ax1 = fig.add_subplot(2,1,1)
ax2 = fig.add_subplot(2,1,2)
cars.plot("weight", "mpg", kind='scatter', ax=ax1)
cars.plot("acceleration", "mpg", kind='scatter', ax=ax2)
plt.show()
分别取weight,mpg画散点图,再取acceleration,mpg画散点图,结果如下
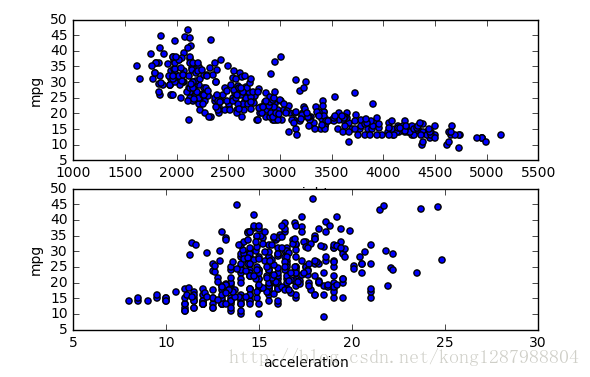
可以看出第一个图总体趋势很好,所以使用第一个图的两列数据来训练模型。
import sklearn
from sklearn.linear_model import LinearRegression
lr = LinearRegression()
lr.fit(cars[["weight"]], cars["mpg"])这里要用到机器学习库中的线性回归模型
from sklearn.linear_model import LinearRegression
实例化一个对象lr来操作
调用fit命令,将数据中的两列信息都传进去
import sklearn
from sklearn.linear_model import LinearRegression
lr = LinearRegression(fit_intercept=True)
lr.fit(cars[["weight"]], cars["mpg"])
predictions = lr.predict(cars[["weight"]])
print(predictions[0:5])
print(cars["mpg"][0:5])
使用代码来看看训练的效果,predict命令就会产生预测值啦
plt.scatter(cars["weight"], cars["mpg"], c='red')
plt.scatter(cars["weight"], predictions, c='blue')
plt.show()
从图中看出了预测出的值基本的趋势还是很正确的
最后再来看一下方差和标准差
lr = LinearRegression()
lr.fit(cars[["weight"]], cars["mpg"])
predictions = lr.predict(cars[["weight"]])
from sklearn.metrics import mean_squared_error
mse = mean_squared_error(cars["mpg"], predictions)
print(mse)![]()
mse = mean_squared_error(cars["mpg"], predictions)
rmse = mse ** (0.5)
print (rmse)![]()
用到了新的库均方误差
from sklearn.metrics import mean_squared_error


