pyecharts和matplotlib:基于python柱状图可视化
matplotlib可视化柱状图
人员信息表person:http://download.csdn.net/download/lxb1022/9933828
#coding:utf-8
import numpy as np
import pandas as pd
import matplotlib as mpl
import matplotlib.pyplot as plt
from matplotlib.font_manager import FontProperties
myfont = FontProperties(fname='/usr/share/fonts/wqy-zenhei/wqy-zenhei.ttc')
fig=plt.figure()
ax1 = fig.add_subplot(221)
ax2 = fig.add_subplot(222)
ax3 = fig.add_subplot(223)
ax4 = fig.add_subplot(224)
df = pd.read_excel('/home/soft/person.xls')
#排名前5的省份人数
province = df.groupby('province').count()
provincenum= province.loc[:,['num']].sort_index(axis=0,by='num',ascending=False).head(5)
x=range(len(provincenum))
y=list(provincenum['num'])
slicegender = df.loc[:,['num','province','gender']].groupby(['province','gender']).count()
boyy=[]
girly=[]
girlx=[]
boyx=[]
width=0.4
for i in x:
    boyy.append(slicegender.loc[list(provincenum.index)[i],u'男'][0])
    girly.append(slicegender.loc[list(provincenum.index)[i],u'女'][0])
    girlx.append(i+width/2)
    boyx.append(i-width/2)
print type(boyy)
h1=ax1.bar(boyx,boyy,color='r',width=width,align='center')
h2=ax1.bar(girlx,girly,color='g',width=width,align='center',yerr=10,ecolor='b',capsize=3)
ax1.set_title(u'各省人员数量',fontproperties=myfont)
ax1.set_xticks(x)
ax1.set_xticklabels(list(provincenum.index),fontproperties=myfont)
ax1.set_xlabel(u'省份',fontproperties=myfont)
ax1.set_ylabel(u'人数',fontproperties=myfont)
ax1.set_ylim(0,150)
ax1.set_yticks(range(0,150,15))
ax1.yaxis.grid(True, linestyle='--',color='grey', alpha=.75)
ax1.legend((h1[0],h2[0]),(u'男',u'女'),prop=myfont,fancybox=True,shadow=True,ncol=2,loc='upper center')
#堆叠柱状图
ax2.bar(x,boyy,color='r',width=width,align='center')
ax2.bar(x,girly,color='g',width=width,align='center',bottom=boyy)
for i in x:
   ax2.text(x[i],int(boyy[i]/2),boyy[i],horizontalalignment='center',verticalalignment='center',color='w')
   ax2.text(x[i],boyy[i]+int(girly[i]/2),girly[i],horizontalalignment='center',verticalalignment='center',color='w')
ax2.set_ylim(0,200)
ax2.set_yticks(range(0,200,20))
ax2.legend((h1[0],h2[0]),(u'男',u'女'),prop=myfont,fancybox=True,shadow=True,ncol=1)
ax2.set_xticks(x)
ax2.set_xticklabels(list(provincenum.index),fontproperties=myfont)
#条状图
ax3.barh(boyx,boyy,color='red',height=width)
ax3.barh(girlx,girly,color='g',height=width)
ax3.xaxis.grid(True, linestyle='--',color='grey', alpha=.75)
#正负条状图
ax4.barh(x,-np.array(boyy),color='red',height=width)
ax4.barh(x,np.array(girly),color='g',height=width)
for i in x:
    ax4.text(-np.array(boyy[i])+10,x[i],boyy[i],color='w',horizontalalignment='center',verticalalignment='center')
    ax4.text(np.array(girly[i])-10,x[i],girly[i],color='w',horizontalalignment='center',verticalalignment='center')
ax4.set_yticks(x)
ax4.set_yticklabels(list(provincenum.index),fontproperties=myfont,rotation=90)
ax4.legend((h1[0],h2[0]),(u'男',u'女'),prop=myfont,fancybox=True,shadow=True,ncol=1,loc='upper left')

plt.show()
下面看一下pyecharts可视化:
#coding:utf-8
import numpy as np
import pandas as pd
from pyecharts import Bar,Map
df = pd.read_excel('/home/soft/person.xls')
num = df.loc[:,['num','gender','province']]
top5 =  num.groupby(['province']).count().sort_values(by='num',ascending=False).head(5)
gendernum = num.groupby(['province','gender']).count()
attr =map(lambda x:x.encode('utf8'),list(top5.index))
value= list(top5['num'])
man=[]
woman=[]
for i in range(len(attr)):
    man.append(gendernum.loc[list(top5.index)[i],u'男'][0])
    woman.append(gendernum.loc[list(top5.index)[i],u'女'][0])
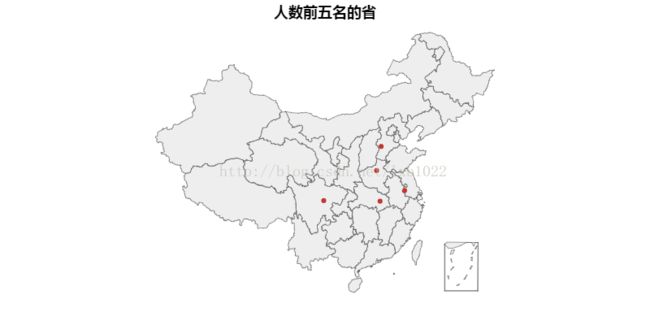
map = Map('人数前五名的省',title_pos='center')
map.add('',attr,value,maptype='china')
map.show_config()
map.render('/home/soft/map.html')
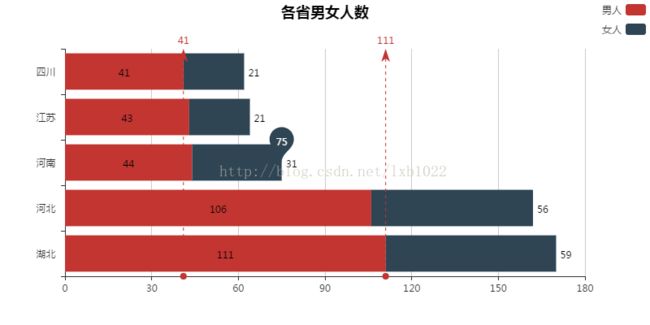
bar = Bar('各省男女人数',title_pos='center')
bar.add("男人",attr,man,is_label_show=True,is_convert=True,label_pos='inside',legend_orient='vertical',\
         mark_line=["min", "max"],is_stack=True)
bar.add("女人",attr,woman,is_label_show=True,label_pos='right',legend_pos='right',\
        legend_orient='vertical',mark_point=["average"],is_convert=True,is_stack=True)
bar.show_config()
bar.render('/home/soft/bar.html')
男女柱状图:


