db2top详解
Introduction
There are several methods to collect information and diagnose DB2 system performance issues. The snapshot monitor is one of the most commonly used tools to collect information in order to narrow down a problem. However, most entries in snapshots are cumulative values and show the condition of the system at a point in time. Manual work is needed to get delta value for each entry from one snapshot to the next.
The db2top tool comes with DB2, and can be used to calculate the delta values for those snapshot entries in real time. This tool provides a GUI under a command line mode, so that users can get a better understanding while reading each entry. This tool also integrates multiple types of DB2 snapshots, categorizes them, and presents them in different screens for the GUI environment.
This article introduces some commonly used screens in db2top utility in daily performance monitoring and troubleshooting work. You'll have a chance to examine several examples that show how to use this tool to narrow down problems in real cases. After reading this article, you will be able to:
- Understand how the db2top utility works
- Interpret the most useful entries in several most commonly used screens
- Monitor system performance, know whether there is something abnormal in daily operations, and be able to solve the problem by using db2top.
Read on, or link directly to the section that interests you:
- db2top command syntax
- How to start db2top
-
- Run db2top in interactive mode
- Run db2top in batch mode
- What can be monitored by db2top?
-
- Database (d)
- Tablespace (t)
- Dynamic SQL (D)
- Session (l)
- Bufferpool (b)
- Lock (U)
- Table (T)
- Bottlenecks (B)
- Case analysis
-
- Case 1: Lock waiting analysis in interactive mode
- Case 2: Performance analysis in replay mode
- Conclusion
Most entries or elements of interest are highlighted in red on figures or in bold text.
All the screenshots are captured from running db2top in interactive mode.
In this article, database "sample" will be used in each example and screenshot.
db2top command syntax
This article does not discuss the db2top command syntax in detail. Detailed command syntax and the user manual can be found in the DB2 Information Center.
 Usage: db2top [-d dbname] [-n nodename] [-u username] [-p password] [-V schema] [-i interval] [-P [part]] [-a] [-B] [-R] [-k] [-x] [-f file [+time] [/HH:MM:SS]] [-b options [-s [sample]] [-D separator] [-X] -o outfile] [-C] [-m duration] db2top -h -d : Database name (default DB2DBDFT) -n : Node name -u : User name -p : User password -V : Default explain schema -i : Interval in seconds between snapshots -b : background mode option: d=database, l=sessions, t=tablespaces, b=bufferpools, T=tables, D=Dynamic SQL, s=Statements, U=Locks, u=Utilities, F=Federation, m=Memory -X=XML Output, -L=Write queries to ALL.sql, -A=Performance analysis -o : output file for background mode
w in db2top to generate the resource configuration file. |
Back to top
How to start db2top
db2top can be run in two modes, interactive mode or batch mode. In interactive mode, the user enters command directly at the terminal text user interface and waits for the system to respond. Note that the left and right arrow keys on the keyboard can be used to scroll columns to left or right, so that you can see the hidden columns on many screens in interactive mode. On the other hand, in batch mode a series of jobs are executed without user interaction.
Run db2top in interactive mode
Enter the following command from a command line to start db2top in interactive mode:
db2top -d sample |
Figure 1. To run db2top in interactive mode
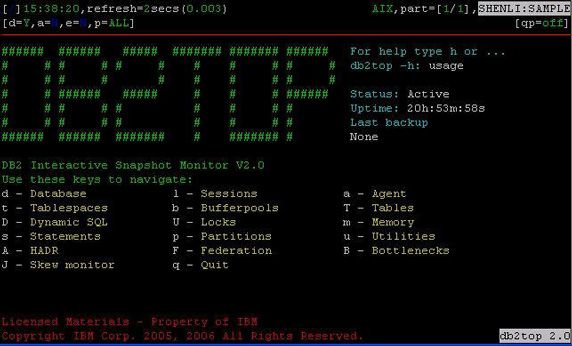
In Figure 1, field values are returned at the top of the screen:
[\]15:38:20, refresh=2secs(0.003) AIX, part=[1/1],SHENLI:SAMPLE
- [/]: When rotating, it means that db2top is waiting between two snapshots, otherwise, it means db2top is waiting for an answer from DB2.
- 15:38:20: Current time
- refresh=2secs: Time interval
- refresh=!secs: The exclamation mark means the time to process the snapshot by DB2 is longer than the refresh interval. In this case, db2top increases the interval by 50 percent. If this occurs too often because the system is too busy, you can either increase the snapshot interval (option I), monitor a single database partition (option P), or turn off extended display mode (option x).
- 0.003: Time spent inside DB2 to process the snapshot
- AIX: Platform on which DB2 is running
- Inactive: Means that the database has not been activated, otherwise it indicates that the database is activated.
- part=[1/1]: Active database partition number versus total database partition number. For example, part=[2,3] means one database partition out of three is down (2 active, 3 total).
- SHENLI: Instance name
- SAMPLE: Database name
[d=Y,a=N,e=N,p=ALL] [qp=off]
- d=Y/N: Delta or cumulative snapshot indicator (command option
-kor optionk) - a=Y/N: Active only or all objects indicator (
-acommand optionsetori) - e=Y/N: Extended display indicator
- p=ALL: All database partitions
- p=CUR: Current database partition (
-Pcommand option with no partition number specified) - p=3: Target database partition number: say 3
- db2top can be used to monitor a DPF environment. If the
-Pcommand option is not specified, a global snapshot should be captured. - qp=off/on: Query patroller indicator (DYNMGMT database configuration parameter) for the database partition on which db2top is attached
Below the status field, a user manual is displayed and can be selected by pressing keys on the keyboard.
Run db2top in batch mode
You can use db2top in batch mode to monitor a running database unattended. Users can record performance information using db2top in the background and the historical data is stored for further analysis.
The following code listing shows how you would run db2top in collection mode for a long period (for example, eight hours in total, and a 15 seconds interval between each snapshot):
db2top -d sample -f collect.file -C -m 480 -i 15 [11:36:02] Starting DB2 snapshot data collector, collection every 15 second(s), max duration 480 minute(s), max file growth/hour 100.0M, hit [CTRL+C] to cancel... [11:36:02] Writing to 'collect.file', should I create a named pipe instead of a file [N/y]? N |
Make sure N is input to answer the question.
After the data has been collected into the file, users can use the following commands to run db2top in replay mode, in order to analyze the data gathered during the period of data collection:
db2top -d sample -f collect.file -b l -A |
Option -A enables automatic performance analysis. So, the above command will analyze the most active sessions, which takes up the most CPU usage.
The following command runs db2top in replay mode, jumping to the time of interest to analyze.
db2top -d sample -f collect.file /HH:MM:SS |
For example, the user restarts db2top in replay mode and it jumps to 2am exactly:
db2top -d sample -f collect.file /02:00:00 |
then, the user enters l to analyze what the session was doing.
Back to top
What can be monitored by db2top?
Database (d)
Figure 2. Database screen
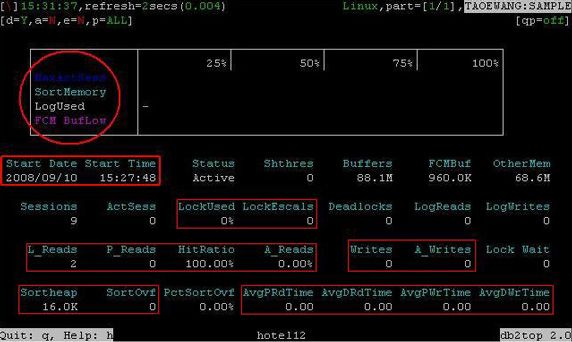
On the database screen, db2top provides a set of performance monitoring elements for the entire database.
Users can monitor active session (MaxActSess), sort memory (SortMemory), and log space (LogUsed). These monitoring elements can help users identify what is the current percentage of usage for those elements. If one of those elements starts reaching high or even 100 percent, users should start to investigate what happened.
The elapsed time between database Start Time and the current time can be used to understand how long the database has being activated. This value can be very useful when combined with other monitoring elements to investigate issues that have been floating around over a period of time.
Lock usage (LockUsed) and escalation (LockEscals) can be very helpful to narrow down locking issues. If a huge number of lock escalations is observed, it is a good idea to increase the LOCKLIST and MAXLOCKS database parameters, or start looking at bad queries that may request a huge amount of locks.
L_Reads, P_Reads, and A_Reads represent Logical Reads, Physical Reads, and Asynchronous Reads. Combined with the hit ratio (HitRatio) value, these variables are very important to evaluate whether most of the reads happened in memory or in disk I/O. Since disk I/O is much slower than in-memory-access, users may prefer to access data in memory as much as possible. When users see the HitRatio dropping low, it is then a good time to start looking at whether the bufferpools are not large enough, or if there is any bad query requesting too much table scans and flushing out other pages from memory to disk.
Similarly with reads, A_Writes represents Asynchronous Writes, which indicates the data pages are written by an asynchronous page cleaner agent before the buffer pool space is required. By knowing the number of writes happened during the elapsed time of the refresh rate of db2top, users also know how many write requests have been made in the database. This could be useful to calculate the average time cost per write, which may be helpful in analyzing some performance issues caused by an I/O bottleneck. Users may expect a maximum ratio of A_Writes/Writes for best writing I/O performance.
SortOvf represents Sort Overflow. If users find that this number goes very high, it might be good to look around queries. Sort Overflow happens when Sortheap is not large enough, so that a SORT or HashJoin operation may overflow the data into temp space. Sometime the value can be dropped by increasing the size of Sortheap, but in other cases, it may not help much if the data set being sorted is much larger than the memory that can be allocated to Sortheap. The sort overflow could be a major bottleneck in a case like that. It may require physical I/O to proceed SORT or Hash Join if the amount of data requested is larger than what the bufferpool can hold in temp space. Therefore, optimizing queries to reduce the number of sort overflows could significantly help the performance of the system.
The last four entries in the Database screen show the Average Physical Read time (AvgPRdTime), Average Direct Read Time (AvgDRdTime), Average Physical Write time (AvgPWrTime), and Average Direct Write time (AvgDWrTime). These four entries directly reflect the performance of the I/O subsystem. If users observed an unexpected large amount of time spent on each Read or Write operation, further investigation should be made into the I/O subsystem.
Tablespace (t)
Figure 3. Tablespace screen
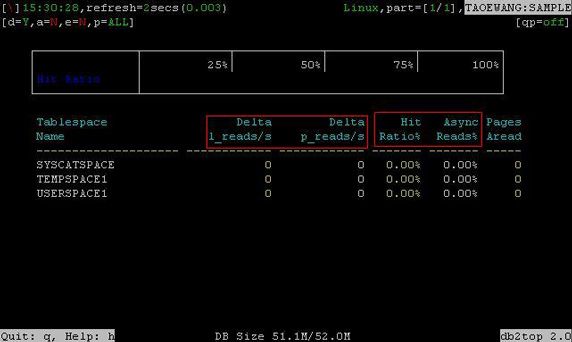
The tablespace screen provides detailed information for each tablespace. The Hit Ratio% and Async Read% columns can be very important to many users. You may not get precise enough information by only monitoring the bufferpool hit ratio at the database level. In an environment that contains many tablespaces, a bad query occurring in one tablespace could be obscured by averaging the hit ratio over all tablespaces. Monitoring Hit Ratio% and Async Read% on each tablespace level can be useful to analyze how a system works in detail.
Delta logical reads(writes) and Delta physical reads(writes) (Delta l_reads(writes) and Delta p_reads(writes)) illustrate how "busy" those tablespaces are. Some tablespaces may not have a very high bufferpool hit ratio but they may also not have much activity. It is good to put more tuning effort into the tablespaces that have more activity than those idle ones in most cases.
The left and right arrow keys on the keyboard can be used to scroll columns to the left or right. The Tablespace screen and some other screens may have multiple columns that cannot be displayed within a single screen. By pressing the left or right arrow keys, users can scroll the screen to display more columns.
By pressing the left arrow key, users can see more read/write entries. Also the average read/write time (vg RdTime / Avg WrTime) can be used to understand what is the average time cost per read/write in the tablespace.
The Space Used, Total Size, and % Full are convenient entries that can be used to easily understand the size of each tablespace and their utilization.
There are also several more columns that can be used to understand the types of tablespaces, for example DMS or SMS, and whether CIO/DIO are enabled or not.
Dynamic SQL (D)
Figure 4. Dynamic SQL screen
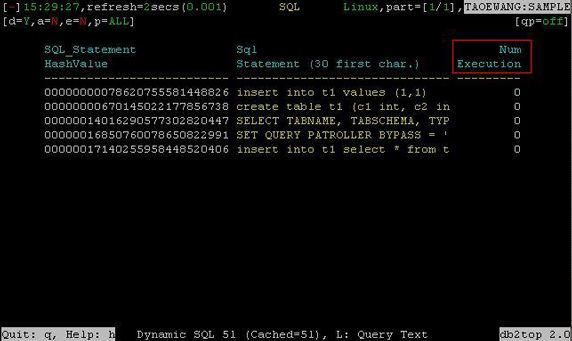
The Dynamic SQL screen provides detailed information for each cached SQL statement. Users can also use this screen to generate db2expln and db2exfmt output for a specific query.
Number of Execution (Num Execution) and Average Execute Time (Avg ExecTime) can be used to understand how many times the specified query has been executed and what the average running time is. Average CPU Time (Avg CpuTime) can be used to compare with the Average Execute Time (Avg ExecTime) to understand what percentage of time is being spent on CPU activities, or most of the time being spent on waiting for locks or I/O.
Rows read and Rows written are useful to understand the behavior of a query. For example, if users seeing a SELECT query associating with a huge number of writings, that may indicate the query may have sort (hash join) overflow and need to be further tuned to avoid data overflow in temp space.
The hit ratio (Hit%) for Data, Index, and Temp l_reads are also calculated in db2top utility to help users easily address whether bufferpool size needs to be tuned. Average Sort Per Execution (AvgSort PerExec) and Sort Time are two good indicators to show how many sorts have been done during the execution.
db2top utility also provides functionality to generate a db2expln or db2exfmt report without manually running the commands. By entering a capital L on the Dynamic SQL screen, it prompts you to enter a SQL hash string. The SQL hash string is the string showing in the first column of the table, for example "00000005429283171301468277." Users can copy the string and paste it into the prompt and click Enter, as shown in Figure 5:
Figure 5. Dynamic SQL screen -- Query text
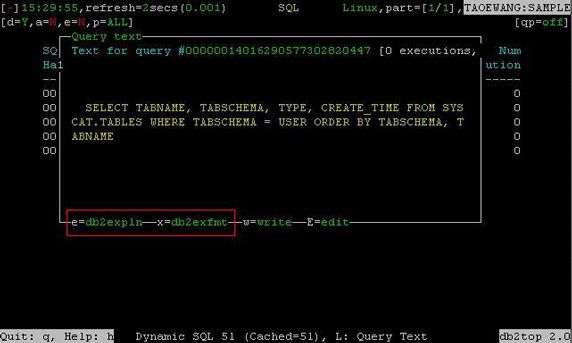
Then, choosing the e option on this screen generates db2expln output, or choosing the x option generates db2exfmt output if the EXPLAIN.DDL has already been imported to the database.
An empty screen is shown if explain tables do not exist or are under different schema than the one currently being used. Users could execute the following command to generate explain tables if necessary.
db2 connect to [dbname] db2 set current schema [Schema name] db2 -tvf [instance home directory]/sqllib/misc/EXPLAIN.DDL db2 terminate |
Session (l)
Figure 6. Session screen
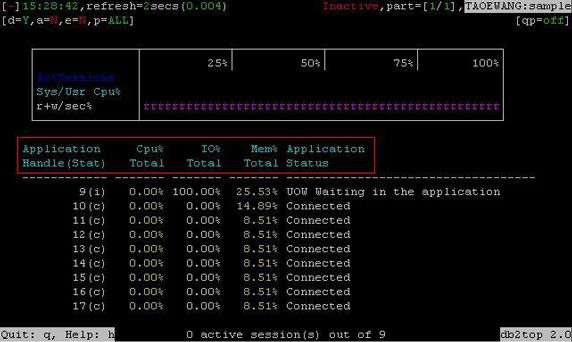
The Session screen provides detailed information for each application session. The first column shows the Application Handle, and the following three columns: CPU% Total, IO% Total, Mem% Total represent the percentage of the resource this application is consuming. In most cases, each session represents one connection from the application side.
Application Status, and some statistics of rows read and write are displayed after these columns. Users can also see LocksHeld, Sorts(sec), and LogUsed information on this screen. LogUsed information could be helpful to users when the transaction log is running out of space. By using this monitor element, users are able to get some ideas about which applications are consuming most of the log space.
The Session screen contains the information similar to what users can see on the Database screen. However, the information on the Session screen is for each application. Usually it is good to combine the data from different screens to do performance analysis. For example, a high number of read problems showing on the Database screen can be further investigated by looking on the Session screen and Dynamic SQL screen in order to narrow it down to a particular application or SQL.
Bufferpool (b)
Figure 7. Bufferpool screen
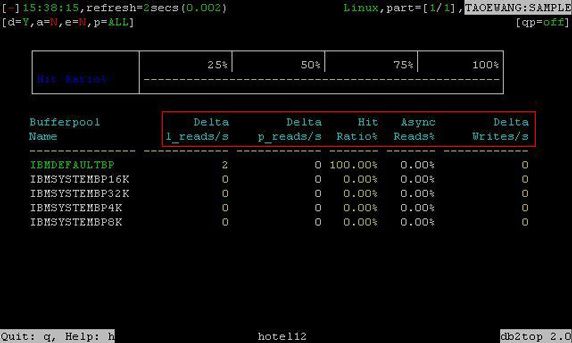
On this screen, db2top provides information about utilization for each bufferpool. Users can see some basic information for bufferpools, such as reads, writes, and size, and can also see more advanced matrices, such as bufferpool Hit Ratio% and Async Reads%.
Generally speaking, bufferpool the hit ratio can be defined like the following matrices:
1 - ((pool_data_p_reads + pool_xda_p_reads + pool_index_p_reads + pool_temp_data_p_reads + pool_temp_xda_p_reads + pool_temp_index_p_reads ) / (pool_data_l_reads + pool_xda_l_reads + pool_index_l_reads + pool_temp_data_l_reads + pool_temp_xda_l_reads + pool_temp_index_l_reads )) * 100% |
Lock (U)
Figure 8. Lock screen
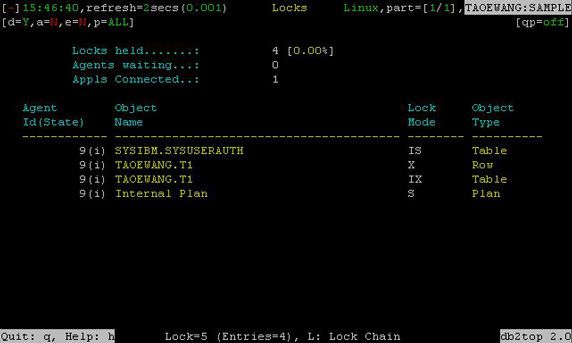
A locking issue is one of the most commonly seen issue during application diagnosis. With db2top utility, users can easily list the locks held by applications.
It is also easier to analyze lock waiting problems using db2top. The following Figures 9, 10, and 11 were captured in a testing scenario where a db2bp application is waiting for another db2bp session.
Figure 9. Lock waiting -- Application status
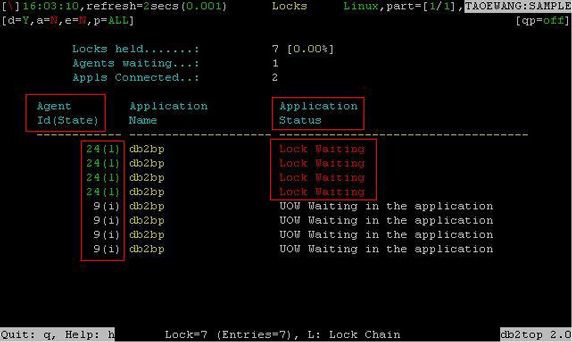
In Figure 9, two agents(agent 24 and agent 9) are listed in the first column: Agent Id(State). You can see that in the third column, Application Status, one of the agents (agent 24) is stuck in Lock Waiting status.
Figure 10. Lock waiting -- Lock status
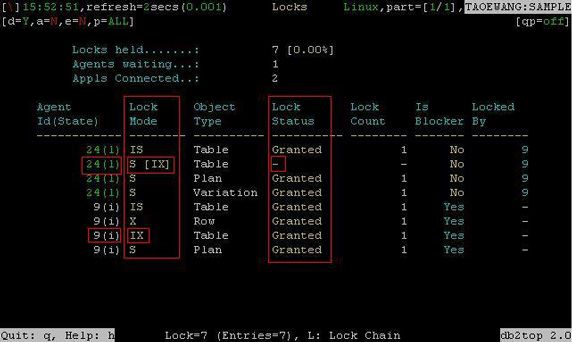
If users want to see more information in the Lock, by pressing left arrow on the keyboard, more columns are displayed, as shown in Figure 10. From the Lock Status column, all locks are in Granted status except one: the lock with "-" status is the lock being blocked. And in the Lock Mode column, both the requested lock mode (S) and the lock that is being held (IX) are displayed.
Figure 11. Lock waiting -- Table name
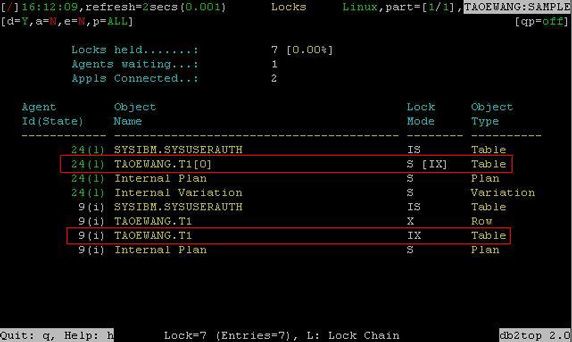
In this particular example, as seen in Figure 11, agent 24 is trying to request the S lock on table TAOEWANG.T1 and it is being locked by agent 9, which is holding the IX lock on the object.
Another very useful feature that db2top can provide in this screen is lock chain analysis. It is not always easy to figure out the lock waiting relationship if multiple applications are involved in the problem. The db2top utility provides a useful feature to dynamically draw the lock chain so that it is much easier for users to understand the locking relationship between applications.
By entering a capital L, the lock chain is displayed. An example output could look similar to Figure 12:
Figure 12. Lock waiting -- Lock chain
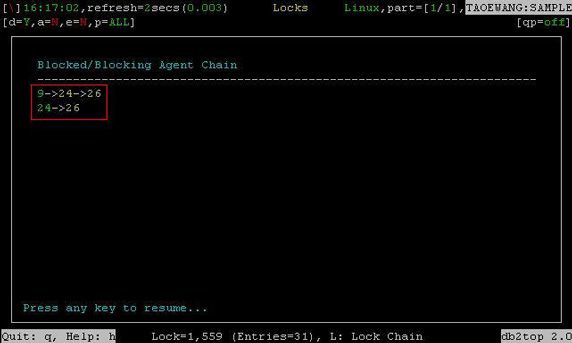
Table (T)
Figure 13. Table screen
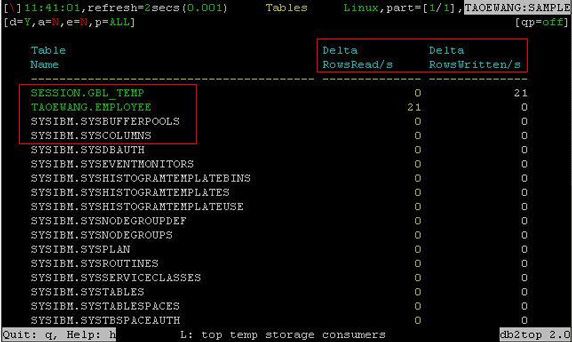
The Table screen shows the table information in the database. The idle table that is not being accessed during the elapsed time is shown in a white color. The tables that are being accessed (active) are shown in a green color.
The Delta RowsRead(Written)/s represent the rows being read and written during the elapsed time divided by the time interval. This number shows how often a particular table is used during the period.
There is also information about the table itself. The columns Data Pages and Index Pages represent how many pages are in the table. Table Type and Table Size are also useful to understand the properties of the table.
Another important column is Rows Overflows/s, which indicates how many row overflows happened every second during the elapsed time. The overflown rows indicate that data fragmentation has occurred. If this number is high, users should improve table performance by reorganizing the table using the REORG utility, which cleans up this fragmentation.
Bottlenecks (B)
Figure 14. Bottlenecks
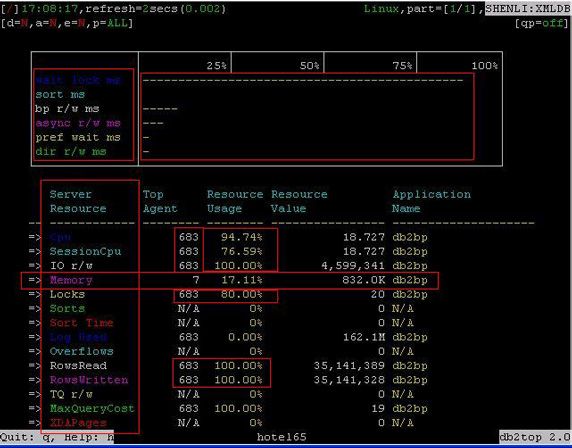
Bottleneck analysis is something that a DBA cannot ignore. They want to know which agent (application) severely limited the performance or capacity of a specific component in the entire DB2 system. db2top answers this call by displaying the main consumer of critical server resources. The agent ID consuming most resources for each category is shown on the screen.
The square box right under the title "Bottleneck" is for the timing analysis of various database operations:
The elapsed time used to calculate the percentage of each operation = (wait_lock_time + sort_time + bp_read_time + bp_write_time + async_read_time + async_write_time + prefetch_waite_time + direct_read_time + direct_write_time).
The following is the estimated percentage for each operation:
- wait lock ms: (wait lock time)/(elapsed time) = 80%
- sort ms : (sort time)/(elapsed time) = 0
- bp r/w ms: (buffer pool read and write time)/(elapsed time) = 10%
- async r/w ms: (async read and write)/(elapsed time) = 6%
- pref wait ms: (prefetch_waite_time)/(elapsed time) = 2%
- dir r/w ms: (direct read and write time)/(elapsed time) = 2%
The main body of the "Bottleneck" screen shows which agent is the bottleneck in each server resource.
The first column, Server Resource, in the screen "Bottlenecks" shows what kind of server resource is monitored:
- Cpu: Which agent consumes the most CPU time.
- SessionCpu: Which application session consumes the most CPU time.
- IO r/w: Which agent consumes the most I/O read and write.
- Memory: Which agent consumes the most memory.
- Lock: Which agent is holding the most locks.
- Sorts: Which agent has executed the biggest number of sorting.
- Sort Times: Which agent consumes the longest sorting time.
- Log Used: Which agent consumes the most log space in the most recent unit of work.
- Overflows: Which agent has the most number of sort overflows.
- RowsRead: Which agent has read the most number of rows of records.
- RowsWritten: Which agent has written the most number of rows of records.
- TQ r/w: Which agent has sent and received most number of rows on table queues.
- MaxQueryCost: Which agent has the max SQL execution time estimated by the compiler.
- XDAPages: Which agent has the most number of pages for XDA data (available in V9.1GA and after releases).
For example: Figure 14 shows that agent 683, which is db2bp (DB2 back end process), is apparently the bottleneck.
As for memory usage bottleneck analysis, you can see the following in Figure 14:
=> Memory 7 17.11% 832.0K db2bp |
This says that among all the agents, agent 7, which is another db2bp (DB2 back end process), consumes the most memory: 17.11 percent or 832.0K.
Back to top
Case analysis
Now that you've looked at the meaning of useful entries on some screens, here are two sample cases to illustrate how to use db2top in a working environment to quickly narrow down the root cause of problems in a system.
The first example is about lock waiting. In this scenario, a heavy workload is running in the background, and a simulation program is trying to delete rows in a table, causing other sessions to be stuck in lock waiting status.
The second case illustrates how to use db2top in replay mode to capture performance information over a period of time, so that a DBA is able to review the information afterward.
Case 1: Lock waiting analysis in interactive mode
By looking at the Bottleneck screen in db2top, you observed huge lock waiting, as showing in Figure 16:
Figure 15. Case 1 -- Lock waiting
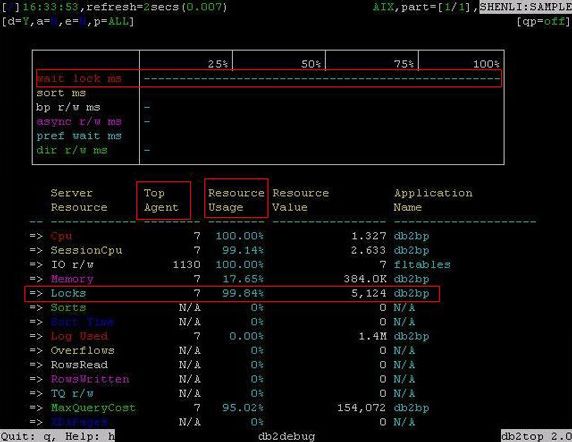
By looking at the box shown at the top of the screen, it is clear that the entry "wait lock ms" took the most time, compared to the other operations. This screenshot tells you that some application(s) are stuck in lock waiting mode and waiting for locks to be released.
Usually, it is useful to find out which application is holding most of the locks in this scenario. From Figure 16, application ID (appid) 7 is shown under the Top Agent column in the Locks row, and the "Resource Usage" column is showing "99.84%" of locks in the entire database are held by this application.
Now, it is useful to look into this application to understand what exactly it was doing (by entering a), or it is also be helpful to look on the Session screen to see which application is waiting for locks (by entering l).
Entering a on the Bottleneck screen prompts users to input the appid. In this case, "7" is input and it leads to the screen shown in Figure 16:
Figure 16. Case 1 -- Lock holding application
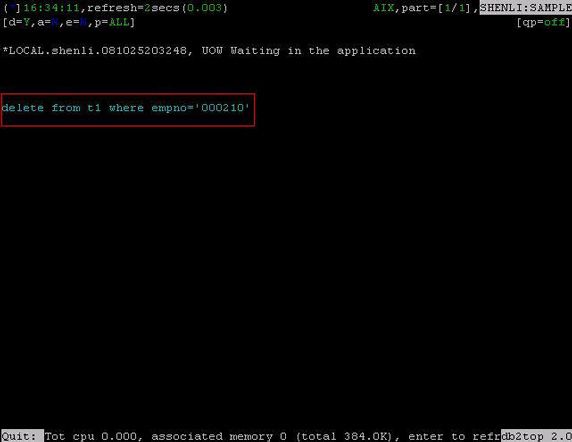
Figure 17 shows the query that was run by appid 7. In this case, the query is "DELETE FROM T1 WHERE EMPNO='000210'."
It is also necessary to confirm whether this query is the one blocking other applications. Sometime it is possible that a lock waiting status occurs by waiting for table locks instead of row locks, which is held by an application with very few locks.
Enter r to go back to the Bottleneck screen, and enter U to go to the Locks screen, as shown in Figure 17.
Figure 17. Case 1 -- Locks
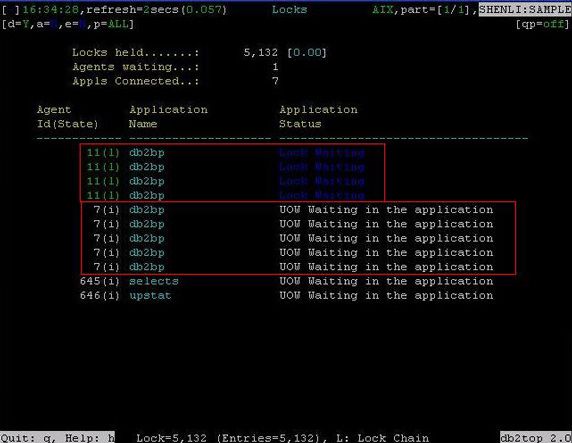
In Figure 17, appid 7 shows the "UOW Waiting" status and appid 11 is in the Lock Waiting status. By pressing the left-arrow key, the screen is scrolled to Figure 18:
Figure 18. Case 1 Lock waiting
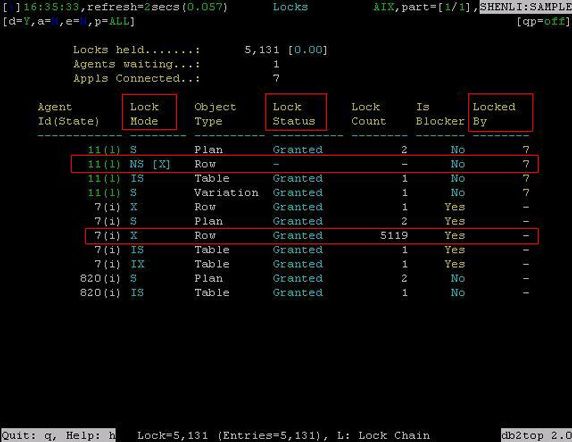
In Figure 18, appid 7 is holding more than 5000 locks. Since the application was deleting rows from the table, there are 5119 X row locks being held by this application.
By looking into appid 11, in the Locked By column, it shows that the locks that appid 11 is requesting are held by appid 7. In the second column, Lock Mode, "NS [X]" means that the application is holding an NS lock on one row and trying to convert into an X lock, and the Lock Status column shows "-",which means that the lock is not granted. Therefore, the Locked By column shows that the appid 7 is the one holding the lock and blocking appid 11 from getting it.
Now it is much more clear what happened to the system. Users may want to know what appid 11 is doing in order to decide whether to let appid 7 continue holding the lock or force it.
By entering a again, and then entering 11, db2top shows the query that was executed by appid 11, as shown in Figure 19.
Figure 19. Case 1 -- Lock waiting application
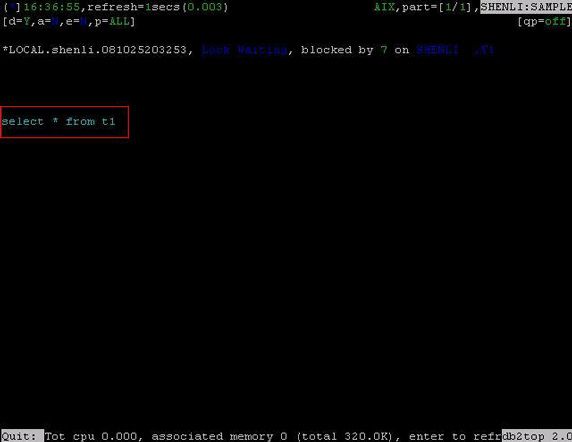
In Figure 20, appid 11 seems to be doing a full query to the table (SELECT * FROM T1). The advice is to remove the locks by killing appid 7, which is running query DELETE FROM T1 WHERE EMPNO='000210'. Therefore, users can switch back to appid 7, enter r to get back to previous screen, enter a and 7 at the prompt, and enter f to force the application.
Case 2: Performance analysis in replay mode
Users can use db2top in replay mode to capture snapshot information over a period of time with the -C option:
db2top -d sample -C -i 15 -m 240 |
The above command captures a snapshot every 15 seconds for 240 minutes. The output file is saved with the default name of db2snap-[dbname]-[platform][bit].bin in the current directory.
Users can use db2top to analyze the output data, or even export the data into delimit format where the columns are separated with ";" character.
In this example, a user program was executed during a batch job running, which caused performance degradation. The data captured by db2top is used to narrow down which program caused the problem.
After data being collected, the following commands can be used to dump data into delimit format:
db2top -d [dbname] -f [filename] -b [screen sub options] |
For example, the following script can dump all screens into different files that can be used to analyze data, or even export data into a table or Microsoft Excel:
db2top -d sample -f db2snap-sample-AIX64.bin -b d > dbout db2top -d sample -f db2snap-sample-AIX64.bin -b l > sessionout db2top -d sample -f db2snap-sample-AIX64.bin -b t > tbspaceout db2top -d sample -f db2snap-sample-AIX64.bin -b b > bpout db2top -d sample -f db2snap-sample-AIX64.bin -b T > tbout db2top -d sample -f db2snap-sample-AIX64.bin -b D > sqlout db2top -d sample -f db2snap-sample-AIX64.bin -b s > stmtout db2top -d sample -f db2snap-sample-AIX64.bin -b U > lockout db2top -d sample -f db2snap-sample-AIX64.bin -b u > utilout db2top -d sample -f db2snap-sample-AIX64.bin -b F > fedout db2top -d sample -f db2snap-sample-AIX64.bin -b m > memout |
There are several ways to narrow down the problem from these data. db2top provides a useful option -A for automatic performance analysis, as shown in Figure 20.
db2top -d sample -f db2snap-sample-AIX64.bin -b l -A |
Figure 20. Case 2 -- Auto analysis
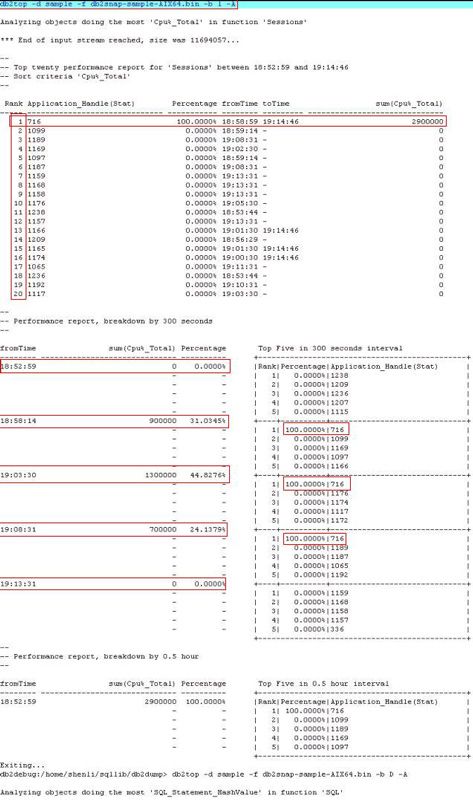
Figure 20 is from the -b l option, which is for session analysis.
The first section shows the top 20 applications consuming most of the CPU. In this case, appid 716 totally consumed almost 100 percent of the CPU from 18:58:59 to 19:14:46.
The second section in the report (Figure 20) shows the top five applications consuming most of the CPU with about a five minute interval.
It can be seen that between 18:52:59 and 18:58:14, there is no applications consuming significantly high CPU. However, between the time 18:58:14 and 19:13:31, appid 716 stayed on top of the list consuming 100 percent of the CPU. This could indicate that appid 716 was doing something odd and needed more analysis.
More detailed information can be seen by piping the delimited output into a database or Microsoft Excel.
Figure 21 was generated in Microsoft Excel from the file dbout, which was for the Database screen:
Figure 21. Case 2 -- I/O spike
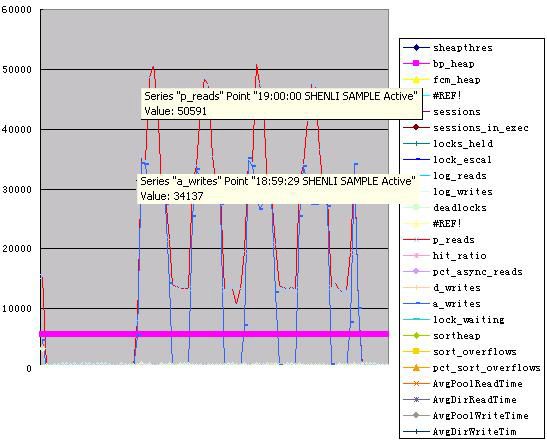
In Figure 21, there are two lines showing a spike in the graph. The red line represents physical reads and the blue line represents async writes.
Therefore, you can conclude that the database was getting very busy during the time when CPU usage was high due to appid 716, which says that it is very possible that appid 716 caused high CPU and I/O usage.
Next, it will be useful to understand exactly what appid 716 was doing when problem occured. db2top replay mode is helpful in this situation. From Figure 20, pick a time when the CPU was busy due to appid 716 (in this example 19:03:30 was chosen) then run the following command:
db2top -d sample -f db2snap-sample-AIX64.bin /19:03:30 |
By switching to Sessions screen (using l), Figure 22 shows the following information:
Figure 22. Case 2 -- Session
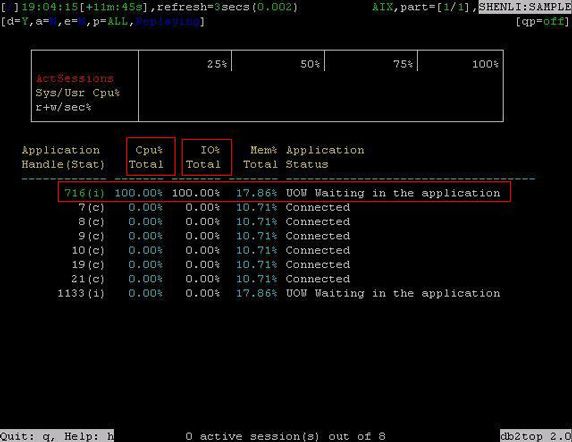
In Figure 22, it is clear that appid 716 was consuming a high amount of CPU and I/O.
Then, entering t to go to the Tablespaces screen shown in Figure 23, shows that the temp space (TEMPSPACE1) usage was high.
Figure 23. Case 2 -- Tablespace
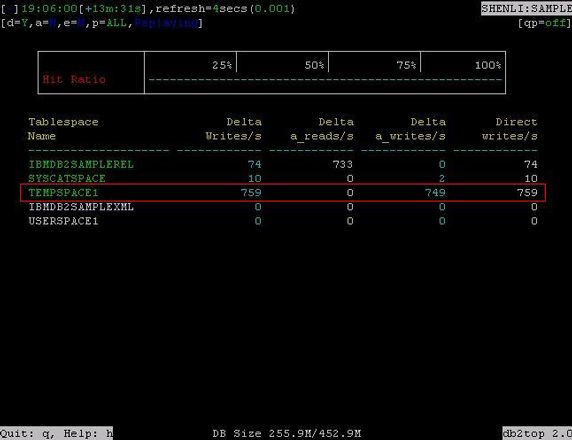
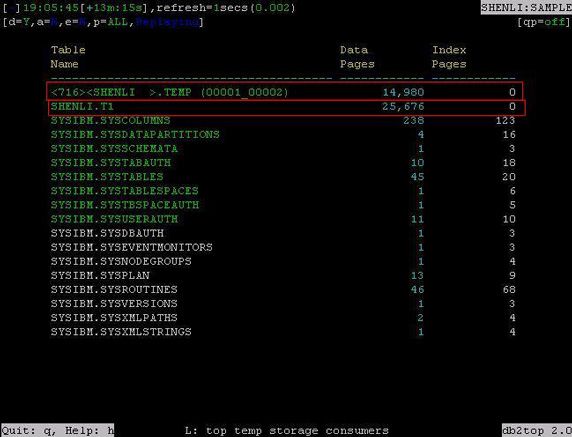
Next, pressing T to go to the Table screen, as shown in Figure 24, the temp table ([716][SHENLI ].TEMP [00001_00002]) on top of the list has a pretty high I/O, and from the name of the table, it can be seen that the temp table was used by appid 716.
Figure 24. Case 2 -- Table
It is also helpful to understand what appid 716 was doing. By entering a and then entering 716, as shown in Figure 25, db2top displays the query that was executed by this application: SELECT * FROM T1 ORDER BY EMPNO
Figure 25. Case 2 -- Statement
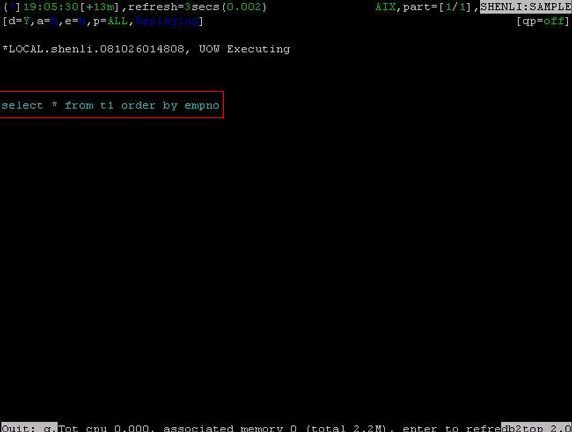
For now, the question is: why the statement caused significantly high CPU and I/O?
By entering x on the above screen, it generates db2exfmt output, as shown in Figure 26.
Figure 26. Case 2 -- db2exfmt
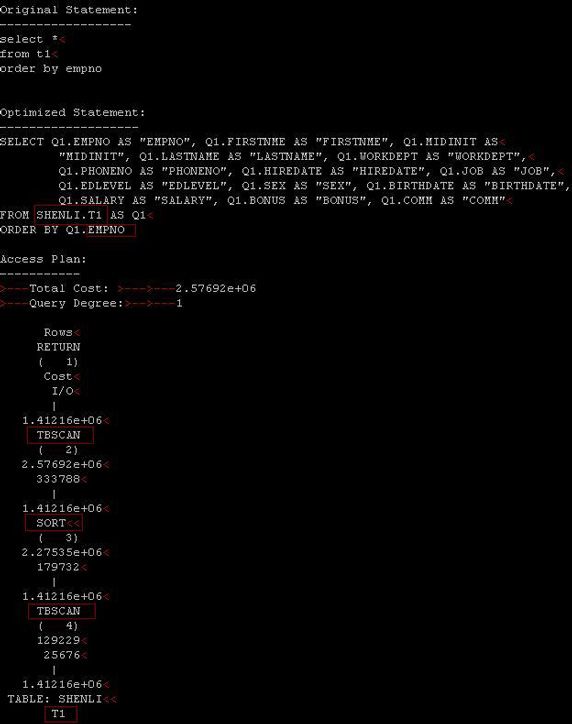
From the explain output (Figures 26 and 27), TBSCAN was used against table T1, and the SORT operation happened on column EMPNO.
Figure 27. Case 2 -- db2exfmt1
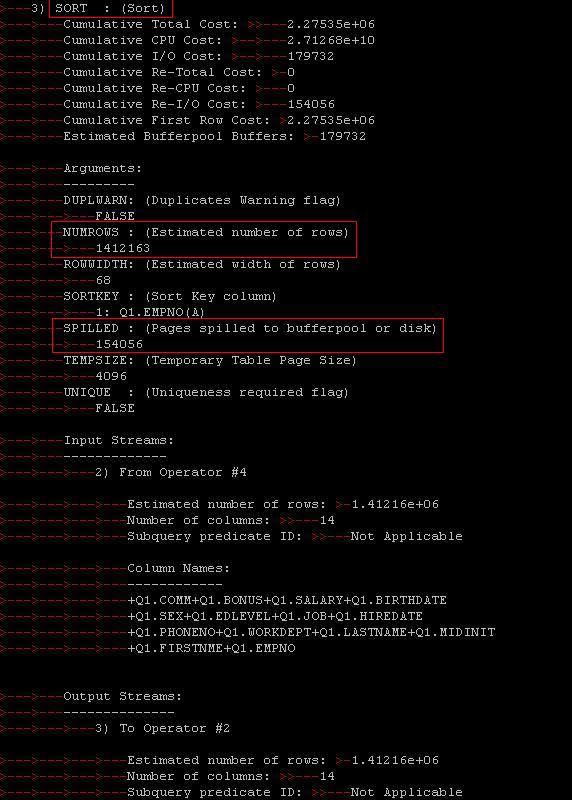
In Figure 27 (part of the explain output ), note that the NUMROWS entry shows "1412163," which indicates the SORT operation will sort the entire 1412163 rows in order to get the result. The SPILLED entry shows 154056, which represents a lot of page spilling for the sort operation. Going back to top of the db2exfmt output, Sort Heap shows "16" only, which indicates that the db2agent was trying to sort the entire 1412163 rows in a 16 page sort heap, which is apparently unable to hold all of the data. Therefore, sort spilling happened and temp space was over used. That means, the SORT operation caused high CPU and spilling caused high I/O usage in the temp space.
Finally, users may ask how to solve this problem. Users can use the db2advis utility to get advice for this query. A typical output of the db2advis query can similar to the following format:
Command:
db2advis -d sample -s "SELECT * FROM T1 ORDER BY EMPNO" -m IMCP |
Output:
-- -- -- LIST OF RECOMMENDED INDEXES -- =========================== -- index[1], 0.095MB CREATE INDEX "SHENLI "."IDX810261919380000" ON "SHENLI "."T1" ("EMPNO" ASC, "COMM" ASC, "BONUS" ASC, "SALARY" ASC, "BIRTHDATE" ASC, "SEX" ASC, "EDLEVEL" ASC, "JOB" ASC, "HIREDATE" ASC, "PHONENO" ASC, "WORKDEPT" ASC, "LASTNAME" ASC, "MIDINIT" ASC, "FIRSTNME" ASC) ALLOW REVERSE SCANS ; COMMIT WORK ; RUNSTATS ON TABLE "SHENLI "."T1" FOR INDEX "SHENLI "."IDX810261919380000" ; COMMIT WORK ; |
The advice is to create an index on table T1 as the query shown in the output.
Back to top
Conclusion
The concept behind db2top is very different from DB2 Health Monitor. DB2 Health Monitor sets up a group of thresholds and keeps monitoring those matrices. Once any of the thresholds is reached, it will trigger the alarm. db2top is basically a tool to periodically capture snapshots and allow users to read the result visually instead of parsing snapshot files.
The db2top utility is a quite useful utility that allows users to monitor a DB2 system in a text graphical interface. The utility can be used to identify whether there is problem during a period of time, and narrow down the root cause of the problem. Users will find this a handy utility for monitoring real-time system and debugging problems in their daily work.