R数据分析多变量
仍然使用facebook用户数据
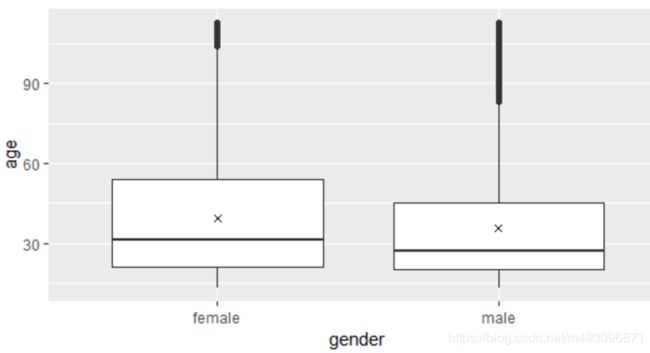
ggplot(aes(x=gender,y=age),
data=subset(pf,!is.na(gender)))+ geom_boxplot() +
stat_summary(fun.y=mean,geom= 'point',shape= 4)
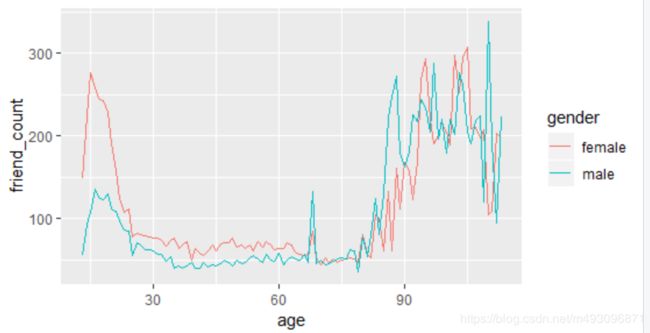
ggplot(aes(x = age,y= friend_count),
data = subset(pf,!is.na(gender)))+
geom_line(aes(color= gender),stat= 'summary',fun.y=median)
suppressMessages(library(dplyr))
suppressMessages(library(dplyr))
pf.fc_by_age_gender <- pf %>%
filter(!is.na(gender)) %>%
group_by(age,gender) %>%
summarise(mean_friend_count = mean(friend_count),
median_friend_count = median(friend_count),
n=n()) %>%
ungroup() %>%
arrange(age)
head(pf.fc_by_age_gender)
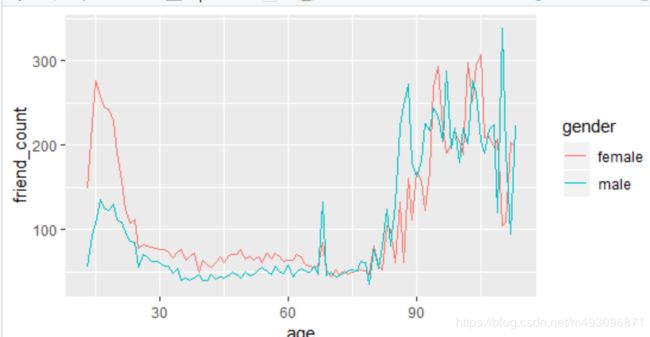
ggplot(aes(x = age, y = friend_count),
data = subset(pf, !is.na(gender))) +
geom_line(aes(color = gender), stat = 'summary', fun.y = median)
ggplot(aes(x = age, y = median_friend_count),
data = pf.fc_by_age_gender) +
geom_line(aes(color = gender))
install.packages("tidyr")
library(tidyr)
spread(subset(pf.fc_by_age_gender,
select = c('gender', 'age', 'median_friend_count')),
gender, median_friend_count)
重塑数据
install.packages("reshape2")
library(reshape2)
pf.fc_by_age_gender.wide <- subset(pf.fc_by_age_gender[c('age', 'gender', 'median_friend_count')], !is.na(gender)) %>%
spread(gender, median_friend_count) %>%
mutate(ratio = male / female)
head(pf.fc_by_age_gender.wide)
pf.fc_by_age_gender.wide <- dcast(pf.fc_by_age_gender,
age ~ gender,
value.var = 'median_friend_count')
head(pf.fc_by_age_gender.wide)
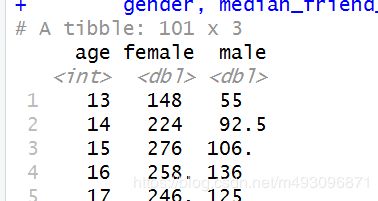
> head(pf.fc_by_age_gender.wide)
age female male
1 13 148.0 55.0
2 14 224.0 92.5
3 15 276.0 106.5
4 16 258.5 136.0
5 17 245.5 125.0
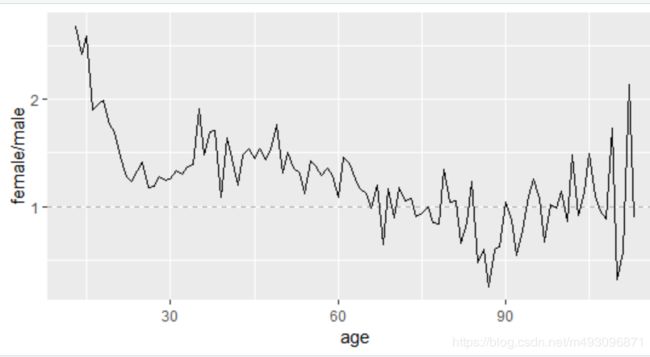
比率图
ggplot(aes(x=age,y= female / male),
data =pf.fc_by_age_gender.wide) +
geom_line() +
geom_hline(yintercept = 1,alpha = 0.3,linetype=2)
pf$year_joined <- floor(2014 - pf$tenure/365)
summary(pf$year_joined)
table(pf$year_joined)
summary(pf$year_joined)
Min. 1st Qu. Median Mean 3rd Qu. Max. NA's
2005 2012 2012 2012 2013 2014 2
> table(pf$year_joined)
2005 2006 2007 2008 2009 2010 2011 2012 2013 2014
9 15 581 1507 4557 5448 9860 33366 43588 70
pf$year_joined.bucket <- cut(pf$year_joined,
c(2004,2009,2011,2012,2014))
table(pf$year_joined.bucket,useNA = 'ifany')
ggplot(aes(x = age, y = friend_count),
data = subset(pf, !is.na(gender))) +
geom_line(aes(color = gender), stat = 'summary', fun.y = median)
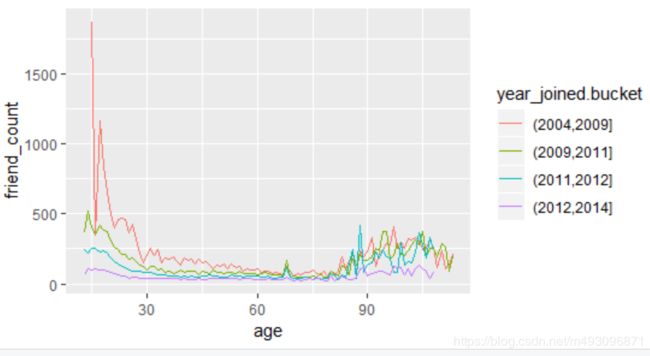
ggplot(aes(x = age, y = friend_count),
data = subset(pf, !is.na(year_joined.bucket))) +
geom_line(aes(color = year_joined.bucket),
stat = 'summary',
fun.y = median)
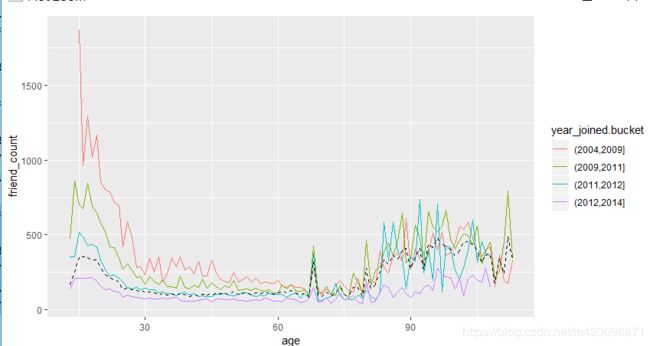
ggplot(aes(x = age, y = friend_count),
data = subset(pf, !is.na(year_joined.bucket))) +
geom_line(aes(color = year_joined.bucket),
stat = 'summary',
fun.y = mean) +
geom_line(stat='summary',fun.y= mean ,linetype=2)
将中位数化为虚线
总结好友率
with(subset(pf,tenure >=1),summary(friend_count / tenure))
Min. 1st Qu. Median Mean 3rd Qu. Max.
0.0000 0.0775 0.2205 0.6096 0.5658 417.0000
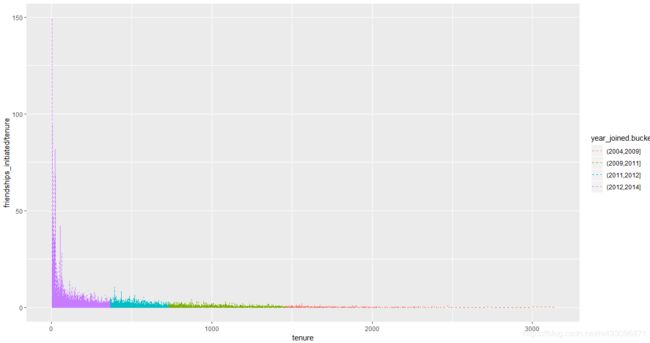
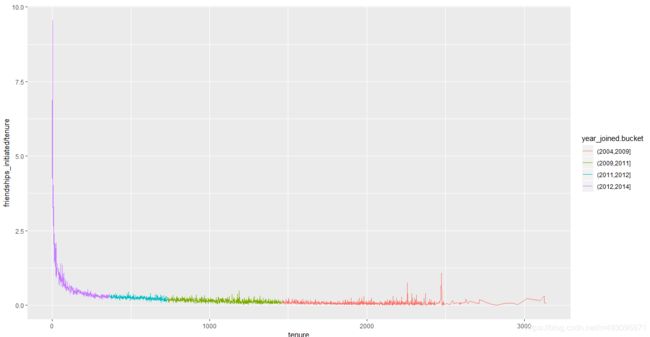
ggplot(aes(x=tenure,y=friendships_initiated /tenure),
data=subset(pf,tenure >=1)) +
geom_line(aes(color=year_joined.bucket))
ggplot(aes(x=tenure,y=friendships_initiated /tenure),
data=subset(pf,tenure >=1)) +
geom_line(aes(color=year_joined.bucket),
stat='summary',
fun.y=mean)
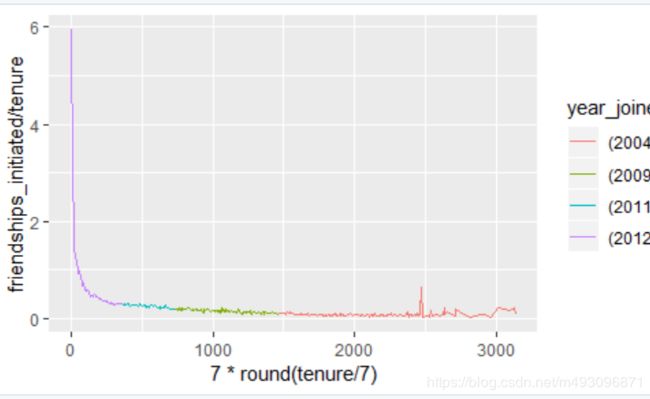
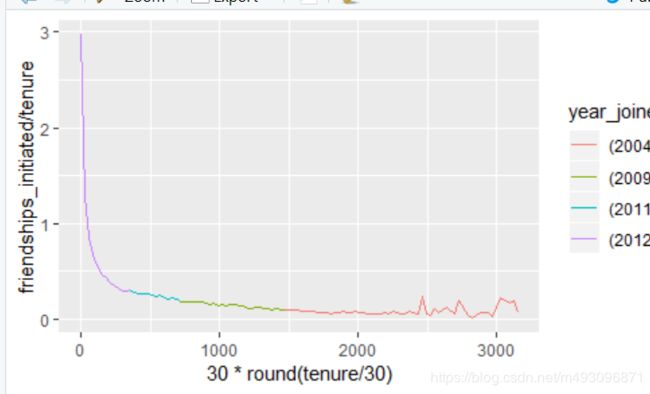
降噪方式1,理解偏差-方差折衷
x = tenure 替换为 x = 7 * round(tenure / 7)
ggplot(aes(x= 7 * round(tenure / 7),y=friendships_initiated /tenure),
data=subset(pf,tenure >=1)) +
geom_line(aes(color=year_joined.bucket),
stat='summary',
fun.y=mean)
ggplot(aes(x= 30 * round(tenure / 30),y=friendships_initiated /tenure),
data=subset(pf,tenure >=1)) +
geom_line(aes(color=year_joined.bucket),
stat='summary',
fun.y=mean)
下面分析酸奶数据集
https://s3.amazonaws.com/udacity-hosted-downloads/ud651/yogurt.csv
首先选择id转换为因子变量
yo <- read.csv('yogurt.csv')
str(yo)
$ id : int 2100081 2100081 2100081 2100081 2100081 2100081 2100081 2100081 2100081 2100081 ...
yo$id <- factor(yo$id)
str(yo)
$ id : Factor w/ 332 levels "2100081","2100370",..: 1 1 1 1 1 1 1 1 1 1 ...
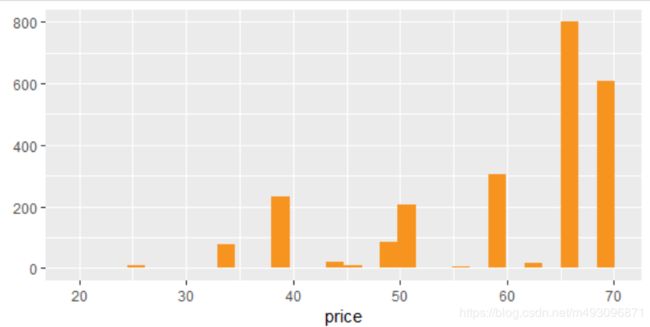
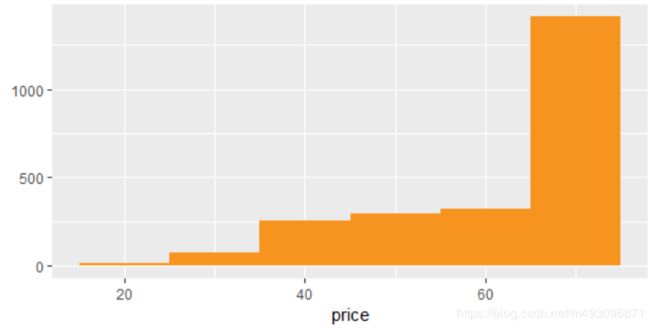
qplot(data= yo ,x = price, fill = I ('#F79420'))
qplot(data= yo ,x = price, fill = I ('#F79420'),binwidth=10)
summary(yo)
unique(yo$price)
length(unique(yo$price))
summary(yo)
obs id time strawberry
Min. : 1.0 2132290: 74 Min. : 9662 Min. : 0.0000
1st Qu.: 696.5 2130583: 59 1st Qu.: 9843 1st Qu.: 0.0000
Median :1369.5 2124073: 50 Median :10045 Median : 0.0000
Mean :1367.8 2149500: 50 Mean :10050 Mean : 0.6492
3rd Qu.:2044.2 2101790: 47 3rd Qu.:10255 3rd Qu.: 1.0000
Max. :2743.0 2129528: 39 Max. :10459 Max. :11.0000
(Other):2061
blueberry pina.colada plain mixed.berry
Min. : 0.0000 Min. : 0.0000 Min. :0.0000 Min. :0.0000
1st Qu.: 0.0000 1st Qu.: 0.0000 1st Qu.:0.0000 1st Qu.:0.0000
Median : 0.0000 Median : 0.0000 Median :0.0000 Median :0.0000
Mean : 0.3571 Mean : 0.3584 Mean :0.2176 Mean :0.3887
3rd Qu.: 0.0000 3rd Qu.: 0.0000 3rd Qu.:0.0000 3rd Qu.:0.0000
Max. :12.0000 Max. :10.0000 Max. :6.0000 Max. :8.0000
price
Min. :20.00
1st Qu.:50.00
Median :65.04
Mean :59.25
3rd Qu.:68.96
Max. :68.96
> length(unique(yo$price))
[1] 20
> unique(yo$price)
[1] 58.96 65.04 48.96 68.96 39.04 24.96 50.00 45.04 33.04 44.00 33.36 55.04
[13] 62.00 20.00 49.60 49.52 33.28 63.04 33.20 33.52
创建购买数的新变量,这里第一个方法使用了传递函数
yo <- transform(yo,all.purchases = strawberry+
blueberry+pina.colada+plain+mixed.berry)
或者
yo$all.purchases <- yo$strawberry+
yo$blueberry+yo$pina.colada+yo$plain+yo$mixed.berry
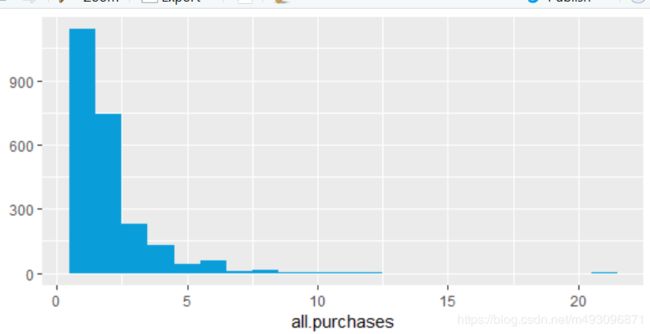
summary(yo$all.purchases)
Min. 1st Qu. Median Mean 3rd Qu. Max.
1.000 1.000 2.000 1.971 2.000 21.000
qplot(x = all.purchases,data = yo, binwidth = 1,
fill = I('#099DD9'))
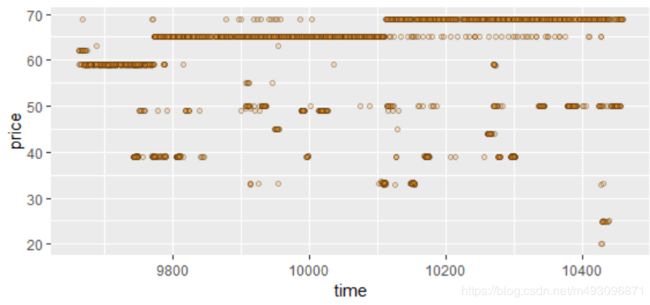
ggplot(aes(x = time, y = price),data = yo) +
geom_jitter(alpha = 1/4, shape = 21, fill = I('#F79420'))
x %in% y 返回一个长度与 x 相同的逻辑(布尔)向量,该向量指出 x 中的每一个条目是否都出现在 y 中。也就是说,对于 x 中的每一个条目,该向量都会检查这一条目是否也出现在 y 中。
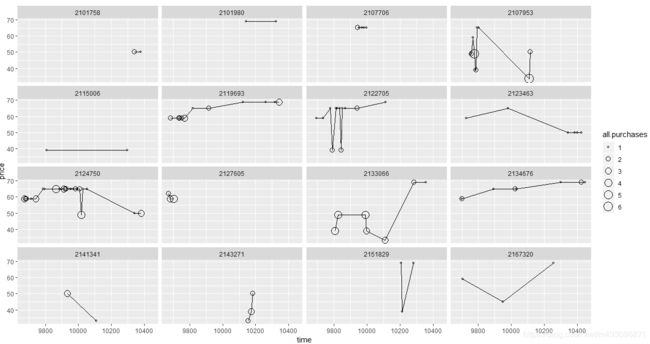
这样,我们就能将数据子集化,从而获得样本中住户的所有购买时机了。然后,我们通过样本 ID 创建价格与时间的散点图和分面。
在绘制散点时,使用 pch 或 shape 参数来指定符号
set.seed(4230)
sample.ids <- sample(levels(yo$id), 16)
ggplot(aes(x = time, y = price),
data = subset(yo, id %in% sample.ids))+
facet_wrap( ~ id ) +
geom_line() +
geom_point(aes(size = all.purchases), pch = 1 )
散点图矩阵
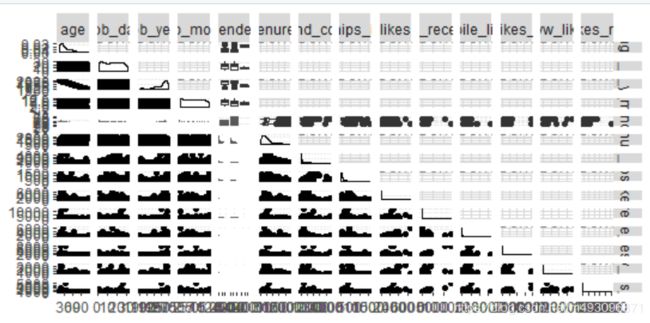
install.packages('GGally') 来安装包,以创建此特定的散点图矩阵。
如果图形需要很长时间才能呈现,或者如果你想查看散点图矩阵的其中一部分,你只需检查少量的变量。你可以使用以下代码或选择较少的变量。我们建议将性别(第 6 个变量)包含在内! pf_subset <- pf[ , c(2:7)]
你可能还会发现:变量标签是在散点图矩阵的外边缘上,而非对角线上。如果你希望标签在对角线上,你可以在 ggpairs 命令中设置 axisLabels = 'internal' 参数。
install.packages('GGally')
library(GGally)
theme_set(theme_minimal(20))
set.seed(1836)
pf_subset <- pf[, c(2:15)]
names(pf_subset)
ggpairs(pf_subset[sample.int(nrow(pf_subset),1000), ])
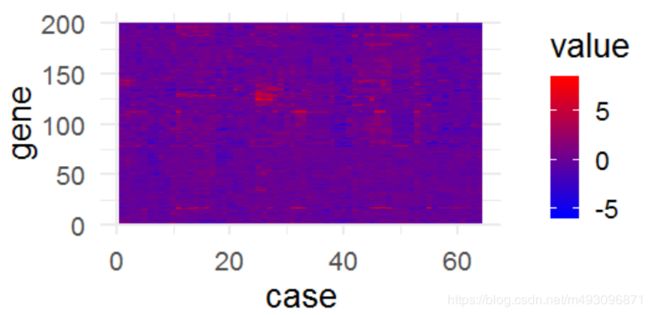
制作热图
下面使用基因数据集
https://s3.amazonaws.com/udacity-hosted-downloads/ud651/nci.tsv
library(reshape2)
nci <- read.table('nci.tsv')
colnames(nci) <- c(1:64)
nci.long.samp <- melt(as.matrix(nci[1:200, ]))
names(nci.long.samp) <- c('gene', 'case', 'value')
head(nci.long.samp)
ggplot (aes(y = gene, x = case, fill = value),
data = nci.long.samp ) +
geom_tile() +
scale_fill_gradientn(colours = colorRampPalette(c('blue',
'red'))(100))
