YOLO-v3模型参数anchor设置
1. 背景知识
在YOLO-v2版本中就引入了anchor box的概念,极大增加了目标检测的性能。但是在训练自己数据的时候还是用模型中原有的anchor设置显然是有点不合适的,那么就涉及到根据自己的训练数据来设置anchor。
那么,首先我们需要知道anchor的本质是什么,本质是SPP(spatial pyramid pooling)思想的逆向。而SPP本身是做什么的呢,就是将不同尺寸的输入resize成为相同尺寸的输出。所以SPP的逆向就是,将相同尺寸的输出,倒推得到不同尺寸的输入。
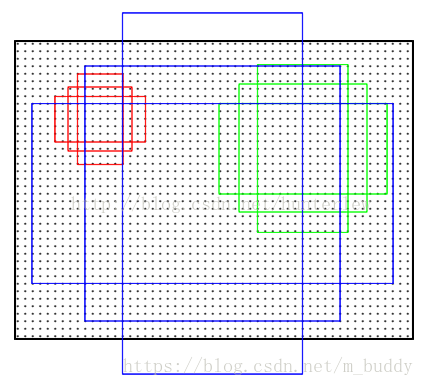
接下来是anchor的窗口尺寸,这个不难理解,三个面积尺寸( 12 8 2 , 25 6 2 , 51 2 2 128^2,256^2,512^2 1282,2562,5122),然后在每个面积尺寸下,取三种不同的长宽比例 ( 1 : 1 , 1 : 2 , 2 : 1 ) (1:1,1:2,2:1) (1:1,1:2,2:1).这样一来,我们得到了一共9种面积尺寸各异的anchor。示意图如下:

那么anchor在目标检测中是怎么使用的呢?那就先来看Faster R-CNN中的运用,下面是整个网络的结构图:

利用anchor是从第二列这个位置开始进行处理,这个时候,原始图片已经经过一系列卷积层和池化层以及relu,得到了这里的 feature:51x39x256(256是层数)在这个特征参数的基础上,通过一个3x3的滑动窗口,在这个51x39的区域上进行滑动,stride=1,padding=2,这样一来,滑动得到的就是51x39个3x3的窗口。对于每个3x3的窗口,作者就计算这个滑动窗口的中心点所对应的原始图片的中心点。然后作者假定,这个3x3窗口,是从原始图片上通过SPP池化得到的,而这个池化的区域的面积以及比例,就是一个个的anchor。换句话说,对于每个3x3窗口,作者假定它来自9种不同原始区域的池化,但是这些池化在原始图片中的中心点,都完全一样。这个中心点,就是刚才提到的,3x3窗口中心点所对应的原始图片中的中心点。如此一来,在每个窗口位置,我们都可以根据9个不同长宽比例、不同面积的anchor,逆向推导出它所对应的原始图片中的一个区域,这个区域的尺寸以及坐标,都是已知的。而这个区域,就是我们想要的 proposal。所以我们通过滑动窗口和anchor,成功得到了 51x39x9 个原始图片的proposal。接下来,每个proposal我们只输出6个参数:每个 proposal 和 ground truth 进行比较得到的前景概率和背景概率(2个参数)(对应图上的 cls_score);由于每个 proposal 和 ground truth 位置及尺寸上的差异,从 proposal 通过平移放缩得到 ground truth 需要的4个平移放缩参数(对应图上的 bbox_pred)。
2. Anchor先验参数计算
这里计算训练数据的anchor先验直接使用的是转好的数据,即是已经转好的可直接训练的数据。这里使用的代码参考的是这个仓库kmeans-anchor-boxes。各位可以到仓库里面下载里面的KMeans文件就可以了,这里给出我使用的部分代码:
# -*- coding=utf-8 -*-
import glob
import os
import sys
import xml.etree.ElementTree as ET
import numpy as np
from kmeans import kmeans, avg_iou

# 根文件夹
ROOT_PATH = '/data/DataBase/YOLO_Data/V3_DATA/'
# 聚类的数目
CLUSTERS = 6
# 模型中图像的输入尺寸,默认是一样的
SIZE = 640

# 加载YOLO格式的标注数据
def load_dataset(path):
    jpegimages = os.path.join(path, 'JPEGImages')
    if not os.path.exists(jpegimages):
        print('no JPEGImages folders, program abort')
        sys.exit(0)
    labels_txt = os.path.join(path, 'labels')
    if not os.path.exists(labels_txt):
        print('no labels folders, program abort')
        sys.exit(0)

    label_file = os.listdir(labels_txt)
    print('label count: {}'.format(len(label_file)))
    dataset = []

    for label in label_file:
        with open(os.path.join(labels_txt, label), 'r') as f:
            txt_content = f.readlines()

        for line in txt_content:
            line_split = line.split(' ')
            roi_with = float(line_split[len(line_split)-2])
            roi_height = float(line_split[len(line_split)-1])
            if roi_with == 0 or roi_height == 0:
                continue
            dataset.append([roi_with, roi_height])
            # print([roi_with, roi_height])

    return np.array(dataset)

data = load_dataset(ROOT_PATH)
out = kmeans(data, k=CLUSTERS)

print(out)
print("Accuracy: {:.2f}%".format(avg_iou(data, out) * 100))
print("Boxes:\n {}-{}".format(out[:, 0] * SIZE, out[:, 1] * SIZE))

ratios = np.around(out[:, 0] / out[:, 1], decimals=2).tolist()
print("Ratios:\n {}".format(sorted(ratios)))
经过运行之后得到一组如下数据:
[[0.21203704 0.02708333]
 [0.34351852 0.09375   ]
 [0.35185185 0.06388889]
 [0.29513889 0.06597222]
 [0.24652778 0.06597222]
 [0.24861111 0.05347222]]
Accuracy: 89.58%
Boxes:
 [135.7037037  219.85185185 225.18518519 188.88888889 157.77777778
 159.11111111]-[17.33333333 60.         40.88888889 42.22222222 42.22222222 34.22222222]
其中的Boxes就是得到的anchor参数,以上面给出的计算结果为例,最后的anchor参数设置为
anchors = 135,17, 219,60, 225,40, 188,42, 157,42, 159,34
由于KMeans算法的结果对于初始点的选取敏感,因而每次运行的结果并不相同,只有Accuracy结果比较稳定点。至于那个anchor参数好,只有自己去尝试了。但是在使用的时候,没改过anchor经过一段时间的训练之后网络也能够适应,至于会不会对检测的精度有影响,暂时还没验证,-_-||。。。
为什么YOLOv2和YOLOv3的anchor大小有明显区别?
在YOLOv2中,作者用最后一层feature map的相对大小来定义anchor大小。也就是说,在YOLOv2中,最后一层feature map大小为13X13(不同输入尺寸的图像最后的feature map也不一样的),相对的anchor大小范围就在(0x0,13x13],如果一个anchor大小是9x9,那么其在原图上的实际大小是288x288。
而在YOLOv3中,作者又改用相对于原图的大小来定义anchor,anchor的大小为(0x0,input_w x input_h]。所以,在两份cfg文件中,anchor的大小有明显的区别。如下是作者自己的解释:
So YOLOv2 I made some design choice errors, I made the anchor box size be relative to the feature size in the last layer. Since the network was down-sampling by 32. This means it was relative to 32 pixels so an anchor of 9x9 was actually 288px x 288px.
In YOLOv3 anchor sizes are actual pixel values. this simplifies a lot of stuff and was only a little bit harder to implement
https://github.com/pjreddie/darknet/issues/555#issuecomment-376190325
3. 参考
- K-means 计算 anchor boxes