python matplotlib.pyplot.plot
matplotlib.pyplot.plot
matplotlib.pyplot 下分有 plot(),pie() 等很很很多种作图方法。
本文将介绍较为常用的 plot 方法。
plot
定义
在坐标轴上(Axes),二维画(Plot)线(line)和/或标记(markers)。参数是变长参数,其可以是 多组(x,y)对 以及可以选参数 显示格式字符串 等 。
Plot lines and/or markers to the Axes. args is a variable length argument, allowing for multiple x, y pairs with an optional format string.
函数
matplotlib.pyplot.plot(*args, **kwargs)
通用用法
通用用法
plot(x, y)        # plot (x, y), style = 默认
                  #               color = 默认
带style的画法
plot(x, y, 'bo')  # plot (x, y), style = 圆形标记(circle)
                  #               color = 蓝色(blue)
省略 x 轴
plot(y)           # plot (x, y)   x 默认使用索引 0 到 N-1

plot(y, 'r+')     # 同上(ditto),  style = 加号标记(circle)
                  #               color = 红色(red)
分别 plot
plot(x1, y1, 'g^', x2, y2, 'g-')

等同于

plot(x1, y1, 'g^')
plot(x2, y2, 'g-')
画图例 legend
plot([1,2,3], [1,2,3], 'go-', label='line 1', linewidth=2)
plot([1,2,3], [1,4,9], 'rs',  label='line 2')
axis([0, 4, 0, 10])
legend()
抗锯齿 antialiased
plot(x1, y1, x2, y2, antialiased=False)
显示格式的另外写法
plot(x, y, color='green', linestyle='dashed', marker='o',
 markerfacecolor='blue', markersize=12).
显示格式 format
颜色 color 和 风格 sytle(线 line + 标记 marker) 的组合。
如,
plot(x, y, 'r-*') # r为颜色, -为线,*为标记
颜色 color
| character | color | 颜色 |
|---|---|---|
| ‘b’ | blue | 蓝 |
| ‘g’ | green | 绿 |
| ‘r’ | red | 红 |
| ‘c’ | cyan | 青绿 |
| ‘m’ | magenta | 紫红 |
| ‘y’ | yellow | 黄 |
| ‘k’ | black | 黑 |
| ‘w’ | white | 白 |
白色因为白底看不出来。。。
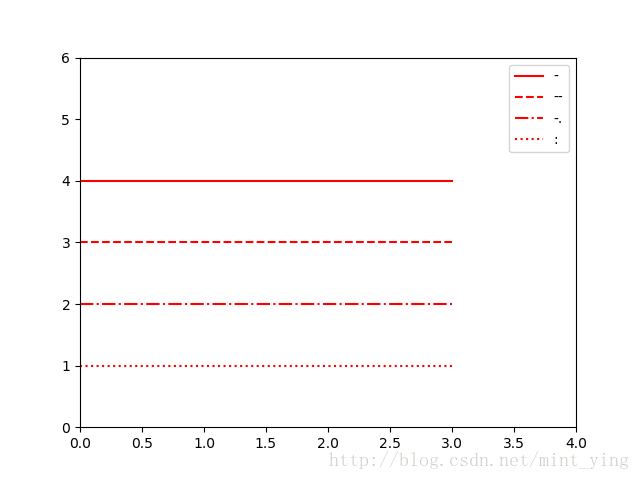
线 line
| character | description | 描述 |
|---|---|---|
| ‘-‘ | solid | 实线 |
| ‘–’ | dashed | 破折线 |
| ‘-.’ | dash-dot | 破折点线 |
| ‘:’ | dotted | 点线 |
标记 markers
| character | description | 描述 |
|---|---|---|
| ‘.’ | point | 圆点 |
| ‘,’ | pixel | 像素点 |
| ‘o’ | circle | 大圆点 |
| ‘v’ | triangle_down | ↓ 实心三角 |
| ‘^’ | triangle_up | ↑ 实心三角 |
| ‘<’ | triangle_left | ← 实心三角 |
| ‘>’ | triangle_right | → 实心三角 |
| ‘1’ | tri_down | ↓ 梅花三角 |
| ‘2’ | tri_up | ↑ 梅花三角 |
| ‘3’ | tri_left | ← 梅花三角 |
| ‘4’ | tri_right | → 梅花三角 |
| ’s’ | square | 方块 |
| ‘p’ | pentagon | 实心五角 |
| ‘*’ | star | 五角星形 |
| ‘h’ | hexagon1 | 实心六角00° |
| ‘H’ | hexagon2 | 实心六角60° |
| ‘+’ | plus | ‘+’ 形 |
| ‘x’ | x | ‘X’ 形 |
| ‘D’ | diamond | 实心菱形 |
| ‘d’ | thin_diamond | 实心瘦菱形 |
| md语法冲突 | vline | 竖线形 |
| ‘_’ | hline marker | 下划线形 |
参考
https://matplotlib.org/api/pyplot_api.html


