matPlotLib绘制决策树
上篇中,实现了创建决策树但并不直观,这里学习绘制决策树,便于直观理解。
Matplotlib提供了名为pylab的模块,其中包括了许多numpy和pyplot中常用的函数,方便用户快速进行计算和绘图,
可以用于IPython中的快速交互式使用。
Matplotlib中的快速绘图的函数库可以通过如下语句载入:
- import matplotlib.pyplot as plt
import matplotlib.pyplot as plt首先注解绘制的树节点和叶节点以及箭头
- #定义文本框和箭头格式
- decisionNode = dict(boxstyle=”sawtooth”, fc=“0.8”) #定义判断节点形态
- leafNode = dict(boxstyle=”round4”, fc=“0.8”) #定义叶节点形态
- arrow_args = dict(arrowstyle=”<-“) #定义箭头
- #绘制带箭头的注解
- #nodeTxt:节点的文字标注, centerPt:节点中心位置,
- #parentPt:箭头起点位置(上一节点位置), nodeType:节点属性
- def plotNode(nodeTxt, centerPt, parentPt, nodeType):
- createPlot.ax1.annotate(nodeTxt, xy=parentPt, xycoords=’axes fraction’,
- xytext=centerPt, textcoords=’axes fraction’,
- va=”center”, ha=“center”, bbox=nodeType, arrowprops=arrow_args )
#定义文本框和箭头格式

decisionNode = dict(boxstyle=”sawtooth”, fc=”0.8”) #定义判断节点形态

leafNode = dict(boxstyle=”round4”, fc=”0.8”) #定义叶节点形态

arrow_args = dict(arrowstyle=”<-“) #定义箭头然后得到叶节点的数目和树的层数
- #计算叶节点数
- def getNumLeafs(myTree):
- numLeafs = 0
- firstStr = myTree.keys()[0]
- secondDict = myTree[firstStr]
- for key in secondDict.keys():
- if type(secondDict[key]).__name__==‘dict’:#是否是字典
- numLeafs += getNumLeafs(secondDict[key]) #递归调用getNumLeafs
- else: numLeafs +=1 #如果是叶节点,则叶节点+1
- return numLeafs
- #计算数的层数
- def getTreeDepth(myTree):
- maxDepth = 0
- firstStr = myTree.keys()[0]
- secondDict = myTree[firstStr]
- for key in secondDict.keys():
- if type(secondDict[key]).__name__==‘dict’:#是否是字典
- thisDepth = 1 + getTreeDepth(secondDict[key]) #如果是字典,则层数加1,再递归调用getTreeDepth
- else: thisDepth = 1
- #得到最大层数
- if thisDepth > maxDepth:
- maxDepth = thisDepth
- return maxDepth
#计算叶节点数
def getNumLeafs(myTree):
    numLeafs = 0
    firstStr = myTree.keys()[0]
    secondDict = myTree[firstStr]
    for key in secondDict.keys():
        if type(secondDict[key]).__name__=='dict':#是否是字典
            numLeafs += getNumLeafs(secondDict[key]) #递归调用getNumLeafs
        else:   numLeafs +=1 #如果是叶节点,则叶节点+1
    return numLeafs
为了清晰简明,在父子节点之间加入文本标签信息
- #在父子节点间填充文本信息
- #cntrPt:子节点位置, parentPt:父节点位置, txtString:标注内容
- def plotMidText(cntrPt, parentPt, txtString):
- xMid = (parentPt[0]-cntrPt[0])/2.0 + cntrPt[0]
- yMid = (parentPt[1]-cntrPt[1])/2.0 + cntrPt[1]
- createPlot.ax1.text(xMid, yMid, txtString, va=”center”, ha=“center”, rotation=30)
#在父子节点间填充文本信息
- #绘制树形图
- #myTree:树的字典, parentPt:父节点, nodeTxt:节点的文字标注
- def plotTree(myTree, parentPt, nodeTxt):
- numLeafs = getNumLeafs(myTree) #树叶节点数
- depth = getTreeDepth(myTree) #树的层数
- firstStr = myTree.keys()[0] #节点标签
- #计算当前节点的位置
- cntrPt = (plotTree.xOff + (1.0 + float(numLeafs))/2.0/plotTree.totalW, plotTree.yOff)
- plotMidText(cntrPt, parentPt, nodeTxt) #在父子节点间填充文本信息
- plotNode(firstStr, cntrPt, parentPt, decisionNode) #绘制带箭头的注解
- secondDict = myTree[firstStr]
- plotTree.yOff = plotTree.yOff - 1.0/plotTree.totalD
- for key in secondDict.keys():
- if type(secondDict[key]).__name__==‘dict’:#判断是不是字典,
- plotTree(secondDict[key],cntrPt,str(key)) #递归绘制树形图
- else: #如果是叶节点
- plotTree.xOff = plotTree.xOff + 1.0/plotTree.totalW
- plotNode(secondDict[key], (plotTree.xOff, plotTree.yOff), cntrPt, leafNode)
- plotMidText((plotTree.xOff, plotTree.yOff), cntrPt, str(key))
- plotTree.yOff = plotTree.yOff + 1.0/plotTree.totalD
- #创建绘图区
- def createPlot(inTree):
- fig = plt.figure(1, facecolor=‘white’)
- fig.clf()
- axprops = dict(xticks=[], yticks=[])
- createPlot.ax1 = plt.subplot(111, frameon=False, **axprops)
- plotTree.totalW = float(getNumLeafs(inTree)) #树的宽度
- plotTree.totalD = float(getTreeDepth(inTree)) #树的深度
- plotTree.xOff = -0.5/plotTree.totalW; plotTree.yOff = 1.0;
- plotTree(inTree, (0.5,1.0), ”)
- plt.show()
#绘制树形图
加载之前创建了tree模块和这个treeplot模块,在命令提示符下输入
- >>> import treeplot
- >>> import tree
- >>> myDat,labels = tree.createDataSet()
- >>> myTree = tree.createTree(myDat,labels)
- >>> treeplot.createPlot(myTree)
>>> import treeplot
>>> import tree
>>> myDat,labels = tree.createDataSet()
>>> myTree = tree.createTree(myDat,labels)
>>> treeplot.createPlot(myTree)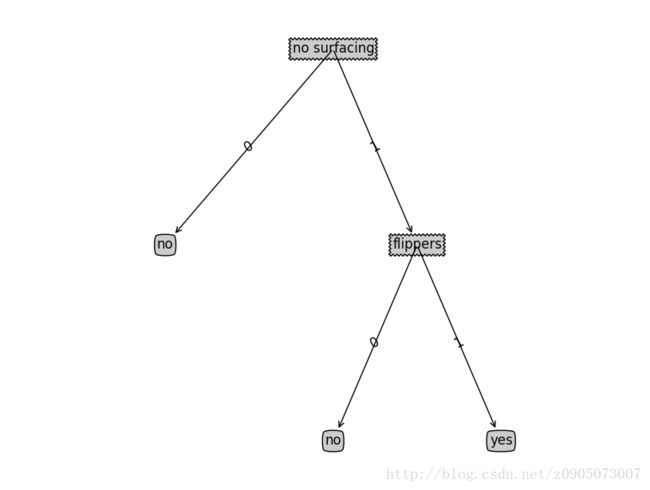
用创建的tree模块和treeplot模块,使用决策树预测隐形眼镜类型;
在命令提示符下输入
- >>> import tree
- >>> import treeplot
- >>> fr = open(’lenses.txt’)
- >>> lenses = [inst.strip().split(’\t’) for inst in fr.readlines()]
- >>> lensesLabels = [’age’,‘prescript’,‘astigmatic’,‘tearRate’]
- >>> lensesTree = tree.createTree(lenses,lensesLabels)
- >>> treeplot.createPlot(lensesTree)
>>> import tree
>>> import treeplot
>>> fr = open('lenses.txt')
>>> lenses = [inst.strip().split('\t') for inst in fr.readlines()]
>>> lensesLabels = ['age','prescript','astigmatic','tearRate']
>>> lensesTree = tree.createTree(lenses,lensesLabels)
>>> treeplot.createPlot(lensesTree)
如有不足,请指出,谢谢~~