前言:
以斯坦福cs231n课程的python编程任务为主线,展开对该课程主要内容的理解和部分数学推导。
该课程相关笔记参考自知乎-CS231n官方笔记授权翻译总集篇发布
k-Nearest Neighbor分类器简介:
k-Nearest Neighbor,简称KNN,翻译过来的意思就是k邻近分类,一个测试与已知的训练集中的数据进行求欧氏距离运算,取前K个距离最短的数据,然后根据前K个数据中标签出现次数最多的便为该测试的标签,更高的k值可以让分类的效果更平滑,使得分类器对于异常值更有抵抗力。
KNN原理
图像分类数据集:CIFAR-10。这个数据集包含了60000张32X32的小图像。每张图像都有10种分类标签中的一种。这60000张图像被分为包含50000张图像的训练集和包含10000张图像的测试集。在下图中你可以看见10个类的10张随机图片。

CIFAR-10数据内容
最简单的求两个数据差异化的方法就是把每个像素相减求平方和,即计算欧氏距离。若不考虑平方的放大效果,可直接做差求和,换句话说,就是将两张图片先转化为两个向量,然后计算他们的 距离d:
过程如下:
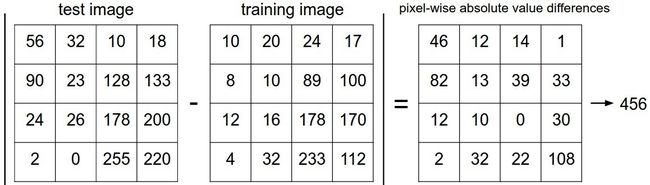
求两张图片差异
根据测试图像和已知数据进行比较后可以的得出当前test image和training image的距离关系,在高维度下不好表示,我们将其想象成二维的im(x,y)。然后我们找出距离最近的K个training image的标签,标签出现次数最多的就是当前test image的标签了。

KNN.jpg
Python实现过程
#coding: utf-8
import numpy as np

class KNearestNeighbor(object):
  def __init__(self):
    pass

  def train(self, X, y):
    """
    Train the classifier. For k-nearest neighbors this is just
    memorizing the training data.

    Inputs:
    - X: A numpy array of shape (num_train, D) containing the training data
      consisting of num_train samples each of dimension D.
    - y: A numpy array of shape (N,) containing the training labels, where
         y[i] is the label for X[i].
    """
    self.X_train = X
    self.y_train = y

  def predict(self, X, k=1, num_loops=0):
    """
    Predict labels for test data using this classifier.

    Inputs:
    - X: A numpy array of shape (num_test, D) containing test data consisting
         of num_test samples each of dimension D.
    - k: The number of nearest neighbors that vote for the predicted labels.
    - num_loops: Determines which implementation to use to compute distances
      between training points and testing points.

    Returns:
    - y: A numpy array of shape (num_test,) containing predicted labels for the
      test data, where y[i] is the predicted label for the test point X[i].
    """
    if num_loops == 0:
      dists = self.compute_distances_no_loops(X)
    elif num_loops == 1:
      dists = self.compute_distances_one_loop(X)
    elif num_loops == 2:
      dists = self.compute_distances_two_loops(X)
    else:
      raise ValueError('Invalid value %d for num_loops' % num_loops)

    return self.predict_labels(dists, k=k)

  def compute_distances_two_loops(self, X):
    """
    Compute the distance between each test point in X and each training point
    in self.X_train using a nested loop over both the training data and the
    test data.

    Inputs:
    - X: A numpy array of shape (num_test, D) containing test data.

    Returns:
    - dists: A numpy array of shape (num_test, num_train) where dists[i, j]
      is the Euclidean distance between the ith test point and the jth training
      point.
    """
    num_test = X.shape[0]
    num_train = self.X_train.shape[0]
    dists = np.zeros((num_test, num_train))
    for i in xrange(num_test):
      for j in xrange(num_train):
        train = self.X_train[j,:]
        test =  X[i,:]
        distence = np.sqrt(np.sum((test-train)**2))#Calculate the eyclidean distance
        dists[i,j]=distence
    return dists

  def compute_distances_one_loop(self, X):
    """
    Compute the distance between each test point in X and each training point
    in self.X_train using a single loop over the test data.

    Input / Output: Same as compute_distances_two_loops
    """
    num_test = X.shape[0]
    num_train = self.X_train.shape[0]
    dists = np.zeros((num_test, num_train))
    for i in xrange(num_test):
      dis_array = X[i,:]-self.X_train
      dists[i,:] = np.sqrt(np.sum(dis_array**2))
    return dists

  def compute_distances_no_loops(self, X):
    """
    Compute the distance between each test point in X and each training point
    in self.X_train using no explicit loops.

    Input / Output: Same as compute_distances_two_loops
    """
    num_test = X.shape[0]
    num_train = self.X_train.shape[0]
    dists = np.zeros((num_test, num_train))
    M = np.dot(X, self.X_train.T)
    te = np.square(X).sum(axis = 1)
    tr = np.square(self.X_train).sum(axis = 1)
    dists = np.sqrt(-2*M+tr+np.matrix(te).T)
    dists = np.array(dists)
    return dists

  def predict_labels(self, dists, k=1):
    """
    Given a matrix of distances between test points and training points,
    predict a label for each test point.

    Inputs:
    - dists: A numpy array of shape (num_test, num_train) where dists[i, j]
      gives the distance betwen the ith test point and the jth training point.

    Returns:
    - y: A numpy array of shape (num_test,) containing predicted labels for the
      test data, where y[i] is the predicted label for the test point X[i].
    """
    num_test = dists.shape[0]
    y_pred = np.zeros(num_test)
    for i in xrange(num_test):
      # A list of length k storing the labels of the k nearest neighbors to
      # the ith test point.
      closest_y = []
      idx = np.argsort(dists[i,:],-1)
      closest_y = self.y_train[idx[:k]]
      closest_set = set(closest_y)#find max label
      for idx,item in enumerate(closest_set):
        y_pred[i]= item
        if idx == 0:
          break
    return y_pred
详细测试部分:
# coding:utf-8

import random
import numpy as np
from data_utils import load_CIFAR10
import matplotlib.pyplot as plt
plt.rcParams['figure.figsize'] = (10.0, 8.0) # set default size of plots
plt.rcParams['image.interpolation'] = 'nearest'
plt.rcParams['image.cmap'] = 'gray'

cifar10_dir = 'datasets/cifar-10-batches-py'#data_path
X_train, y_train, X_test, y_test = load_CIFAR10(cifar10_dir)
print 'Training data shape: ', X_train.shape
print 'Training labels shape: ', y_train.shape
print 'Test data shape: ', X_test.shape
print 'Test labels shape: ', y_test.shape

num_training = 5000 #the trainning number
mask = range(num_training) #create range number
X_train = X_train[mask]
y_train = y_train[mask]

num_test = 500 #the test number
mask = range(num_test)
X_test = X_test[mask]
y_test = y_test[mask]

# Reshape the image data into rows
X_train = np.reshape(X_train, (X_train.shape[0], -1))#-1 mean auto number
X_test = np.reshape(X_test, (X_test.shape[0], -1))
print X_train.shape, X_test.shape

from classifiers import KNearestNeighbor#import

classifier = KNearestNeighbor()
#classifier.train(X_train, y_train)#data and lable
#dists = classifier.compute_distances_no_loops(X_test)
#print dists.shape

#classifier the test and mark the label
#y_test_pred = classifier.predict_labels(dists, k=7)
#num_correct = np.sum(y_test_pred == y_test)
#accuracy = float(num_correct) / num_test
#print 'Got %d / %d correct => accuracy: %f' % (num_correct, num_test, accuracy)

#compare the different function
def time_function(f, *args):
  """
  Call a function f with args and return the time (in seconds) that it took to execute.
  """
  import time
  tic = time.time()
  f(*args)
  toc = time.time()
  return toc - tic

#two_loop_time = time_function(classifier.compute_distances_two_loops, X_test)
#print 'Two loop version took %f seconds' % two_loop_time

#one_loop_time = time_function(classifier.compute_distances_one_loop, X_test)
#print 'One loop version took %f seconds' % one_loop_time
#the faster than anyother
#no_loop_time = time_function(classifier.compute_distances_no_loops, X_test)
#print 'No loop version took %f seconds' % no_loop_time


num_folds = 5
k_choices = [1, 3, 5, 8, 10, 12, 15, 20, 50, 100]

X_train_folds = []
y_train_folds = []

X_train_folds = np.array_split(X_train, num_folds);#split the array
y_train_folds = np.array_split(y_train, num_folds);

k_to_accuracies = {}
for k in k_choices:
    k_to_accuracies[k] = []

for k in k_choices:#find the best k-value
    for i in range(num_folds):
        X_train_cv = np.vstack(X_train_folds[:i]+X_train_folds[i+1:])
        X_test_cv = X_train_folds[i]

        y_train_cv = np.hstack(y_train_folds[:i]+y_train_folds[i+1:])  #size:4000
        y_test_cv = y_train_folds[i]

        classifier.train(X_train_cv, y_train_cv)
        dists_cv = classifier.compute_distances_no_loops(X_test_cv)

        y_test_pred = classifier.predict_labels(dists_cv, k)
        num_correct = np.sum(y_test_pred == y_test_cv)
        accuracy = float(num_correct) / y_test_cv.shape[0]

        k_to_accuracies[k].append(accuracy)
for k in sorted(k_to_accuracies):
    for accuracy in k_to_accuracies[k]:
        print 'k = %d, accuracy = %f' % (k, accuracy)

        # plot the raw observations
for k in k_choices:
  accuracies = k_to_accuracies[k]
  plt.scatter([k] * len(accuracies), accuracies)

# plot the trend line with error bars that correspond to standard deviation
accuracies_mean = np.array([np.mean(v) for k,v in sorted(k_to_accuracies.items())])
accuracies_std = np.array([np.std(v) for k,v in sorted(k_to_accuracies.items())])
plt.errorbar(k_choices, accuracies_mean, yerr=accuracies_std)
plt.title('Cross-validation on k')
plt.xlabel('k')
plt.ylabel('Cross-validation accuracy')
plt.show()

# Based on the cross-validation results above, choose the best value for k,
# retrain the classifier using all the training data, and test it on the test
# data. You should be able to get above 28% accuracy on the test data.
best_k = 1

classifier = KNearestNeighbor()
classifier.train(X_train, y_train)
y_test_pred = classifier.predict(X_test, k=best_k)

# Compute and display the accuracy
num_correct = np.sum(y_test_pred == y_test)
accuracy = float(num_correct) / num_test
print 'Got %d / %d correct => accuracy: %f' % (num_correct, num_test, accuracy)
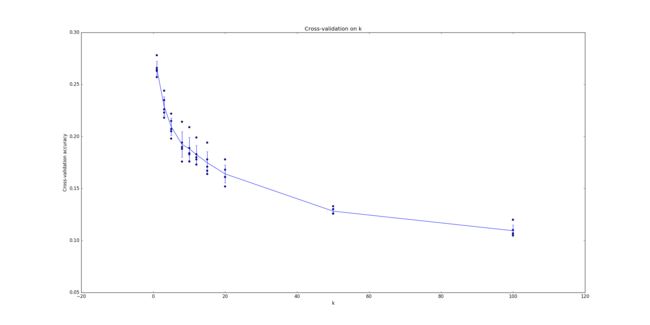
K值对准确率的影响
KNN分类器的优劣:
首先,Nearest Neighbor分类器易于理解,实现简单。其次,算法的训练不需要花时间,因为其训练过程只是将训练集数据存储起来。
然而测试要花费大量时间计算,因为每个测试图像需要和所有存储的训练图像进行比较,这显然是一个缺点。
总体来说KNN分类器的训练花费非常小,而实际的识别开销非常大,在不进行特征提取的情况下很难运用到时间当中去。