GoJs 教程
GoJS教程
有关视频教程,请单击此处。 对于文本教程,请继续阅读。
GoJS是一个用于实现交互式图表的JavaScript库。 本页面将向您展示使用GoJS的基本要素。 如果您更愿意观看视频,请参阅我们的YouTube视频。
因为GoJS是一个依赖于HTML5功能的JavaScript库,所以您需要确保您的页面声明它是HTML5文档。 当然,您需要加载库:
. . .
您可以在此处下载GoJS(以及所有示例)。 或者,您可以直接链接到CDNJS提供的GoJS库:
每个GoJS图都包含在HTML页面中的HTML 在JavaScript代码中,您在创建图时传递 根据这个id创建了一个空图: 请注意,go是所有GoJS类型所在的“命名空间”。 GoJS类的所有代码使用,例如Diagram或Node或Panel或Shape或TextBlock都将以“go”作为前缀。 本文将通过示例向您展示如何使用go.GraphObject.make构建GoJS对象。 有关更多详细信息,请阅读GoJS中的构建对象。 使用$作为go.GraphObject.make的缩写非常方便我们将从现在开始使用它。 如果在代码中使用$代替其他内容,则可以随时选择不同的短变量名称,例如$$或MAKE或GO。 图的节点和链接是由模型管理的数据的可视化。 GoJS有一个模型 - 视图架构,其中Models是包含描述节点和链接的数据(JavaScript对象的数组),Diagrams充当视图,使用实际的Node和Link对象展示这些数据。加载编辑之后保存的是模型而不是图表。 您可以在模型中的数据对象上添加应用程序所需的任何属性; 或者默认Diagram和GraphObject类的原型属性。 这是一个模型和图表的示例,后面是它生成的实际图表: 该图显示了模型中的三个节点。 能够实现一些操作: 通过创建由GraphObjects组成的模板以及在这些对象上设置属性来设置节点的样式。 要创建一个Node,我们可以使用如下几个构建 block类: 所有这些构建块都是从GraphObject抽象类派生的,因此我们随便将它们称为GraphObjects或对象或元素。 请注意,GraphObject不是HTML DOM元素,因此创建或修改此类对象的开销不会太大。 我们希望模型数据属性影响我们的节点,这是通过数据绑定完成的。 数据绑定允许我们通过自动将这些GraphObjects上的属性设置为从模型数据中获取的值来更改节点中GraphObjects的外观和行为。 模型数据对象是纯JavaScript对象。 您可以选择在模型中的节点数据上使用您喜欢的任何属性。 默认的Node模板很简单:包含一个TextBlock的Node。 TextBlock的text属性和模型数据的key属性之间存在数据绑定。 在代码中,模板看起来像这样: TextBlocks,Shapes和Pictures是GoJS的原始构建块。 TextBlocks不能包含图像; 形状不能包含文本。 如果希望节点显示某些文本,则必须使用TextBlock。 如果要绘制或填充某些几何图形,则必须使用Panel。 更一般地说,Node模板的框架看起来像这样: Panel中GraphObjects的嵌套可以进行深度设计,每个类都有自己独特的属性集可供探索,这只是其强大功能的一小部分。 现在我们已经了解了如何制作Node模板,让我们看一个实例。 我们将制作组织图中常见的简单模板 - 图片配名字。 请观察以下Node模板: “Horizontal”属性的 Panel 的节点,意味着其元素将并排水平布局。 它有两个要素: 该代码生成此图: 当不存在所有信息时,我们可能希望显示一些“默认”状态,例如当图像未加载或名称未知时。 此示例中的“空”节点数据用于显示节点模板可以看起来更舒服,也不需要绑定数据上的任何属性。 使用自定义节点模板,我们的图表变得非常美观,但也许我们希望展示更多。 也许我们想要一张组织结构图来证明Don Meow真的是cat cartel的老板。 因此,我们将通过添加一些链接来显示各个节点之间的关系以及自动定位节点的布局,从而创建一个完整的组织结构图。 为了获得我们图表的链接,所以我们不会再基本模型中削减它。 我们将不得不选择GoJS中的另外两个模型中的一个,这两个模型都支持链接。 GraphLinksModel和TreeModel。 在GraphLinksModel中,除了model.nodeDataArray之外,我们还有model.linkDataArray。 它包含一组JavaScript对象,每个对象通过指定“to”和“from”节点键来描述链接。 以下是节点A链接到节点B并且节点B链接到节点C的示例: GraphLinksModel允许您在节点之间拥有任意数量的链接,可以向任何方向前进。 可能有十个链路从A到B运行,另外三个从B到A运行相反的方式。 TreeModel的工作方式略有不同。 不是维护单独的链接数据数组,而是通过为节点数据指定“父”来创建树模型中的链接。 然后从该关联创建链接。 这是与TreeModel相同的示例,其中节点A链接到节点B,节点B链接到节点C: TreeModel比GraphLinksModel简单,但它不能建立任意链接关系,例如同一个两个节点之间的多个链接,或者具有多个父节点。 我们的组织图是一个简单的分层树状结构,因此我们将为此示例选择TreeModel。 首先,我们将通过添加更多节点,使用TreeModel以及在数据中指定键和父项来完成数据。 正如您所看到的,TreeModel会自动创建必要的链接以关联节点,但很难分辨谁是谁。 图表具有默认布局,该布局采用没有位置的所有节点并为其提供位置,并将它们排列在网格中。 我们可以明确地为每个节点提供一个位置来理清这个混乱的组织,但作为一个更简单的解决方案,我们将使用一个自动布局为我们提供良好位置的布局。 我们想要显示层次结构,并且已经在使用TreeModel,因此最自然的布局选择是TreeLayout。 TreeLayout默认从左向右布局,因此要使其从上到下移动布局(在组织图中常见),我们将angle属性设置为90。 在GoJS中使用布局通常很简单。 每种布局都有许多影响结果的属性。 每个布局都有样本(如TreeLayout Demo),展示其属性。 到目前为止,将布局添加到图表和模型中,我们可以看到我们的结果: 我们的图表开始看起来像一个合适的组织结构图,但我们可以通过链接做得更好。 /*这点自行理解*/ We will construct a new Link template that will better suit our wide, boxy nodes. A Link is a different kind of Part, not like a Node. The main element of a Link is the Link's shape, and must be a Shape that will have its geometry computed dynamically by GoJS. Our link is going to consist of just this shape, with its stroke a little thicker than normal and dark gray instead of black. Unlike the default link template we will not have an arrowhead. And we will change the Link 将Link模板与Node模板,TreeModel和TreeLayout相结合,我们最终得到了完整的组织图。 下面重复完整的代码,结果图如下:
var $ = go.GraphObject.make;
var myDiagram =
  $(go.Diagram, "myDiagramDiv");
图表和模型
var $ = go.GraphObject.make;
var myDiagram =
  $(go.Diagram, "myDiagramDiv",
    {
      "undoManager.isEnabled": true // enable Ctrl-Z to undo and Ctrl-Y to redo
    });

var myModel = $(go.Model);
// in the model data, each node is represented by a JavaScript object:
myModel.nodeDataArray = [
  { key: "Alpha" },
  { key: "Beta" },
  { key: "Gamma" }
];
myDiagram.model = myModel;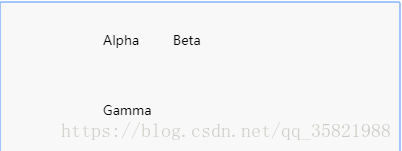
样式节点
myDiagram.nodeTemplate =
  $(go.Node,
    $(go.TextBlock,
      // TextBlock.text is bound to Node.data.key
      new go.Binding("text", "key"))
);myDiagram.nodeTemplate =
$(go.Node, "Vertical", // second argument of a Node/Panel can be a Panel type
/* set Node properties here */
{ // the Node.location point will be at the center of each node
locationSpot: go.Spot.Center
},
/* add Bindings here */
// example Node binding sets Node.location to the value of Node.data.loc
new go.Binding("location", "loc"),
/* add GraphObjects contained within the Node */
// this Shape will be vertically above the TextBlock
$(go.Shape,
"RoundedRectangle", // string argument can name a predefined figure
{ /* set Shape properties here */ },
// example Shape binding sets Shape.figure to the value of Node.data.fig
new go.Binding("figure", "fig")),
$(go.TextBlock,
"default text", // string argument can be initial text string
{ /* set TextBlock properties here */ },
// example TextBlock binding sets TextBlock.text to the value of Node.data.key
new go.Binding("text", "key"))
);
var $ = go.GraphObject.make;
var myDiagram =
  $(go.Diagram, "myDiagramDiv",
    {
      "undoManager.isEnabled": true // enable Ctrl-Z to undo and Ctrl-Y to redo
    });

// define a simple Node template
myDiagram.nodeTemplate =
  $(go.Node, "Horizontal",
    // the entire node will have a light-blue background
    { background: "#44CCFF" },
    $(go.Picture,
      // Pictures should normally have an explicit width and height.
      // This picture has a red background, only visible when there is no source set
      // or when the image is partially transparent.
      { margin: 10, width: 50, height: 50, background: "red" },
      // Picture.source is data bound to the "source" attribute of the model data
      new go.Binding("source")),
    $(go.TextBlock,
      "Default Text",  // the initial value for TextBlock.text
      // some room around the text, a larger font, and a white stroke:
      { margin: 12, stroke: "white", font: "bold 16px sans-serif" },
      // TextBlock.text is data bound to the "name" attribute of the model data
      new go.Binding("text", "name"))
  );

var model = $(go.Model);
model.nodeDataArray =
[ // note that each node data object holds whatever properties it needs;
  // for this app we add the "name" and "source" properties
  { name: "Don Meow", source: "cat1.png" },
  { name: "Copricat", source: "cat2.png" },
  { name: "Demeter",  source: "cat3.png" },
  { /* Empty node data */  }
];
myDiagram.model = model;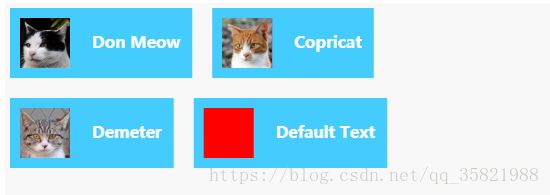
各种模型
var model = $(go.GraphLinksModel);
model.nodeDataArray =
[
  { key: "A" },
  { key: "B" },
  { key: "C" }
];
model.linkDataArray =
[
  { from: "A", to: "B" },
  { from: "B", to: "C" }
];
myDiagram.model = model;var model = $(go.TreeModel);
model.nodeDataArray =
[
{ key: "A" },
{ key: "B", parent: "A" },
{ key: "C", parent: "B" }
];
myDiagram.model = model;
var $ = go.GraphObject.make;
var myDiagram =
  $(go.Diagram, "myDiagramDiv",
    {
      "undoManager.isEnabled": true // enable Ctrl-Z to undo and Ctrl-Y to redo
    });

// the template we defined earlier
myDiagram.nodeTemplate =
  $(go.Node, "Horizontal",
    { background: "#44CCFF" },
    $(go.Picture,
      { margin: 10, width: 50, height: 50, background: "red" },
      new go.Binding("source")),
    $(go.TextBlock, "Default Text",
      { margin: 12, stroke: "white", font: "bold 16px sans-serif" },
      new go.Binding("text", "name"))
  );

var model = $(go.TreeModel);
model.nodeDataArray =
[ // the "key" and "parent" property names are required,
  // but you can add whatever data properties you need for your app
  { key: "1",              name: "Don Meow",   source: "cat1.png" },
  { key: "2", parent: "1", name: "Demeter",    source: "cat2.png" },
  { key: "3", parent: "1", name: "Copricat",   source: "cat3.png" },
  { key: "4", parent: "3", name: "Jellylorum", source: "cat4.png" },
  { key: "5", parent: "3", name: "Alonzo",     source: "cat5.png" },
  { key: "6", parent: "2", name: "Munkustrap", source: "cat6.png" }
];
myDiagram.model = model;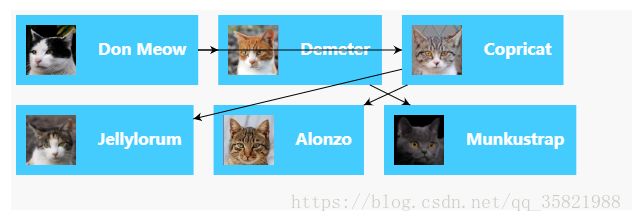
图布局
myDiagram.layout =
  $(go.TreeLayout,
{ angle: 90, layerSpacing: 35 });var $ = go.GraphObject.make;
var myDiagram =
$(go.Diagram, "myDiagramDiv",
{
"undoManager.isEnabled": true, // enable Ctrl-Z to undo and Ctrl-Y to redo
layout: $(go.TreeLayout, // specify a Diagram.layout that arranges trees
{ angle: 90, layerSpacing: 35 })
});
// the template we defined earlier
myDiagram.nodeTemplate =
$(go.Node, "Horizontal",
{ background: "#44CCFF" },
$(go.Picture,
{ margin: 10, width: 50, height: 50, background: "red" },
new go.Binding("source")),
$(go.TextBlock, "Default Text",
{ margin: 12, stroke: "white", font: "bold 16px sans-serif" },
new go.Binding("text", "name"))
);
var model = $(go.TreeModel);
model.nodeDataArray =
[
{ key: "1", name: "Don Meow", source: "cat1.png" },
{ key: "2", parent: "1", name: "Demeter", source: "cat2.png" },
{ key: "3", parent: "1", name: "Copricat", source: "cat3.png" },
{ key: "4", parent: "3", name: "Jellylorum", source: "cat4.png" },
{ key: "5", parent: "3", name: "Alonzo", source: "cat5.png" },
{ key: "6", parent: "2", name: "Munkustrap", source: "cat6.png" }
];
myDiagram.model = model;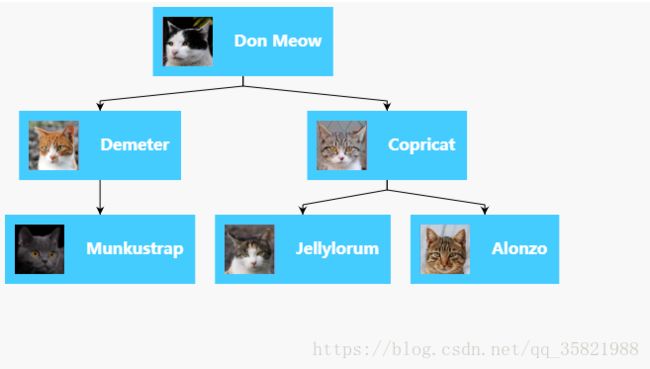
链接模板
routing property from Normal to Orthogonal, and give it a corner value so that right-angle turns are rounded.myDiagram.linkTemplate =
$(go.Link,
// default routing is go.Link.Normal
// default corner is 0
{ routing: go.Link.Orthogonal, corner: 5 },
$(go.Shape, { strokeWidth: 3, stroke: "#555" }) // the link shape
// if we wanted an arrowhead we would also add another Shape with toArrow defined:
// $(go.Shape, { toArrow: "Standard", stroke: null }
);
var $ = go.GraphObject.make;

var myDiagram =
  $(go.Diagram, "myDiagramDiv",
    {
      "undoManager.isEnabled": true, // enable Ctrl-Z to undo and Ctrl-Y to redo
      layout: $(go.TreeLayout, // specify a Diagram.layout that arranges trees
                { angle: 90, layerSpacing: 35 })
    });

// the template we defined earlier
myDiagram.nodeTemplate =
  $(go.Node, "Horizontal",
    { background: "#44CCFF" },
    $(go.Picture,
      { margin: 10, width: 50, height: 50, background: "red" },
      new go.Binding("source")),
    $(go.TextBlock, "Default Text",
      { margin: 12, stroke: "white", font: "bold 16px sans-serif" },
      new go.Binding("text", "name"))
  );

// define a Link template that routes orthogonally, with no arrowhead
myDiagram.linkTemplate =
  $(go.Link,
    { routing: go.Link.Orthogonal, corner: 5 },
    $(go.Shape, { strokeWidth: 3, stroke: "#555" })); // the link shape

var model = $(go.TreeModel);
model.nodeDataArray =
[
  { key: "1",              name: "Don Meow",   source: "cat1.png" },
  { key: "2", parent: "1", name: "Demeter",    source: "cat2.png" },
  { key: "3", parent: "1", name: "Copricat",   source: "cat3.png" },
  { key: "4", parent: "3", name: "Jellylorum", source: "cat4.png" },
  { key: "5", parent: "3", name: "Alonzo",     source: "cat5.png" },
  { key: "6", parent: "2", name: "Munkustrap", source: "cat6.png" }
];
myDiagram.model = model;