ELK日志分析系统安装【6.x】
去elastic官网下载
elasticseach/kibana/logstash
前提需要配置JDK1.8
tar解压elasticseach,kibana,logstash到/usr/local下
elasticseach
elasticseach不能使用root启动,所以需要创建用户来启动
# groupadd elk
# useradd -r -g elk elk
# chown -R elk.elk /usr/local/elasticsearch
# cd /usr/local/elasticsearch
# vim config/elasticsearch.yml
cluster.name: my-application
node.name: PS02-node
path.data: /usr/local/elasticsearch/data
path.logs: /usr/local/elasticsearch/logs
network.host: 192.168.199.152
http.port: 9200
discovery.zen.ping.unicast.hosts: ["192.168.199.152"]
path.data和path.logs目录没有,需要手动创建,并且更改elk属主和属组
elasticsearch安装x-pack,X-Pack 将诸多强大功能集合到一个单独的程序包中,其中就有安全功能Security
# bin/elasticsearch-plugin install x-pack
# bin/x-pack/setup-passwords interactive 设置密码,账号分别为elastic,kibana,logstash_system,后续中kibana和logstash会用到
启动elasticsearch,使用elk用户启动
# su elk
# /usr/local/elasticsearch/bin/elasticsearch -d
启动时间有点慢,耐心等待10-20s或者更长,查看9200,9300端口是否开启
# netstat -tnlp|grep 9[23]00
tcp6       0      0 192.168.199.152:9200    :::*                    LISTEN      60591/java
tcp6       0      0 192.168.199.152:9300    :::*                    LISTEN      60591/java
访问http://192.168.199.152:9200
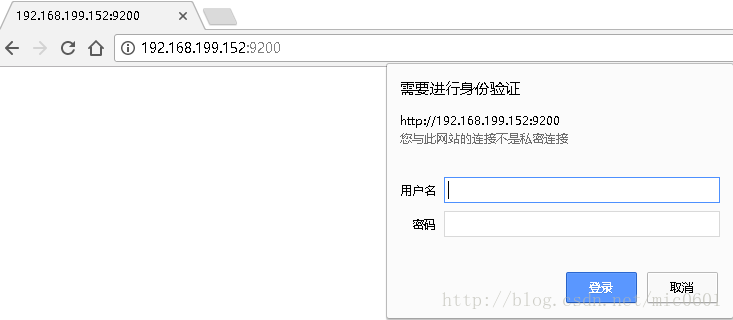
logstash
# cd /usr/local/logstash
# bin/logstash-plugin install x-pack
# vim config/kibana.yml
xpack.monitoring.elasticsearch.url: "http://192.168.199.152:9200"
xpack.monitoring.elasticsearch.username: "logstash_system"
xpack.monitoring.elasticsearch.password: "logstash_password"
logstash启动配置文件需要自己写,logstash是要将日志输出到elastic,下面将一个dubbo服务的日志,输出到elastic中
# cd /usr/local/logstash
# vim logstash-dubbo.conf
input { file {
        path => "/data/dubbologs/qbm-service/qbm-service.log"
        start_position => "beginning"
        }
}

filter {
        grok {
                match => [
                        "message","%{TIMESTAMP_ISO8601:time}\s\[%{JAVACLASS:java_stat}\]\-\[%{WORD:status}\]\s\{%{JAVAFILE:meath}\}\s%{JAVALOGMESSAGE:log}"
                ]
        }
        date {
                match => ["time","yyyy-MM-dd HH:mm:ss"]
                target => "@timestamp"
        }
}

output {
        elasticsearch { hosts => ["192.168.199.153:9200"]
                        user => "elastic"
                        password => "elastic_password"
                        index => "logstash-dubbo-test-%{+YYYY.MM.dd}"
                        }
        stdout { codec => rubydebug }
}
启动logstash,使用root用户启动
# nohup bin/logstash -f logstash-dubbo.conf &
之后访问http://192.168.199.152:9200/_cat/indices/logstash-dubbo*
使用elastic账号登陆,会看到logstash-dubbo-test开头的索引

关于logstash输出到elastic中,方法有很多,根据自己不同的情况写配置文件
kibana
# chown -R elk.elk /usr/local/kibana
# cd /usr/local/kibana
# vim config/kibana.yml
server.port: 5601
server.host: "192.168.199.152"
elasticsearch.url: "http://192.168.199.152:9200"
elasticsearch.username: "kibana"
elasticsearch.password: "kibana_password"
elasticsearch.requestTimeout: 30000
kibana安装x-pack
# bin/kibana-plugin install x-pack
启动kibana
启动后需要等待10~20s,打印日志
# su elk
# nohup /usr/local/kibana/bin/kibana &
访问http://192.168.199.152:5601

使用elastic账号登陆

点击 Management-> Kibana Index Patterns -> Create Index Pattern,搜索以logstash-dubbo-test*的索引,Next step
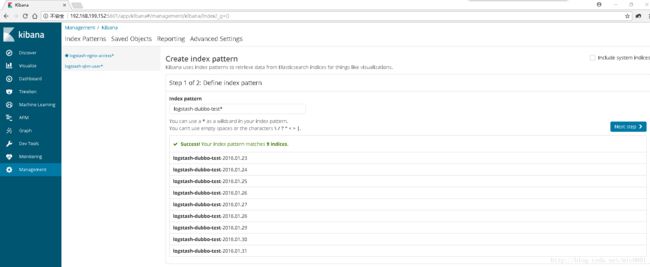
之后在Discover中,可以看到日志信息
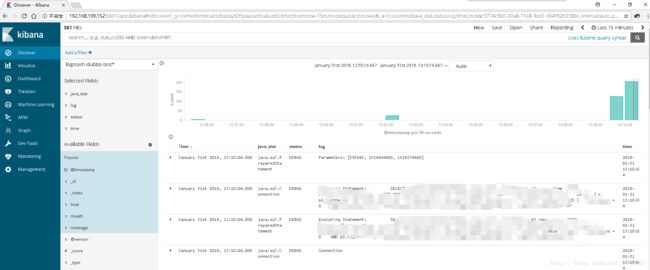
更多功能,继续研究中~~~