回顾:
- 菜鸟数据科学入门01 - 工具包概略
- 菜鸟数据科学入门02 - IPython 基础
为什么用 NumPy?
NumPy 是一个用于科学计算的基础 Python 库(安装说明)。它可以让你在 Python 中使用向量和数学矩阵,以及许多用 C 语言实现的底层函数。
-
简洁优雅
当下大部分数据的组织结构是向量、矩阵或多维数组,NumPy 最重要的一个特点是 N 维数组对象(ndarray)。
-
效率高
方便地计算一组数值,而不用写复杂的循环。
-
灵活兼容
除了擅长科学计算,NumPy 还可以用作通用数据多维容器,可无缝对接各种各样的数据库。
-
敲门砖
在数据科学中,有效的存储和操作数据是基础能力。如果想通过 Python 学习数据科学或者机器学习,就必须学习 NumPy。
在 Notebook 中导入 NumPy:
import numpy as np
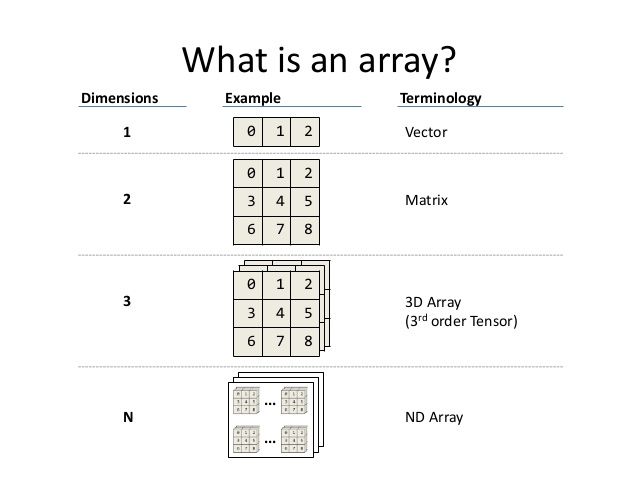
什么是数组
数组是将数据组织成若干个维度的数据块。
Array : data about relationships
- 一维数组是向量(Vectors),由一个整数索引有序元素序列。
- 二维数组是矩阵(Matrics),用一对整数(行索引和列索引)索引元素。
- N 维数组(Arrays)是一组由 n 个整数的元组进行索引的、具有相同数据类型的元素集合。
创建数组
NumPy 的核心是数组(arrays)。
用 array 创建数组
In[]: np.array([1, 4, 2, 5, 3])

Out[]: array([1, 4, 2, 5, 3])
在 NumPy 数组中,数据类型需要一致,否则,会尝试「向上兼容」,比如生成一个包含浮点数的数组,输出时每个元素都变成了浮点型:
In[]: np.array([3.14, 4, 2, 3])

Out[]: array([ 3.14,  4.  ,  2.  ,  3.  ])
NumPy 还可以用循环生成数组:
In[]: np.array([range(i, i + 3) for i in [2, 4, 6]])

Out[]: array([[2, 3, 4],
              [4, 5, 6],
              [6, 7, 8]])
用 full 生成一个 3 行 5 列的数组:
In[]: np.full((3, 5), 3.14)

Out[]: array([[ 3.14,  3.14,  3.14,  3.14,  3.14],
              [ 3.14,  3.14,  3.14,  3.14,  3.14],
              [ 3.14,  3.14,  3.14,  3.14,  3.14]])
用 arange 等距填充数组:
(arange 是 Python 内置函数 range 的数组版,返回的是一个 ndarray 而不是 list)
# Starting at 0, ending at 20, stepping by 2

In[]: np.arange(0, 20, 2)

Out[]: array([ 0,  2,  4,  6,  8, 10, 12, 14, 16, 18])
用 linspace 线性填充数组:
# Create an array of five values evenly spaced between 0 and 1

In[]: np.linspace(0, 1, 5)

Out[]: array([ 0.  ,  0.25,  0.5 ,  0.75,  1.  ])
用 random 生成随机数组:
# Create a 3x3 array of random integers in the interval [0, 10)

In[]: np.random.randint(0, 10, (3, 3))

Out[]: array([[2, 3, 4],
              [5, 7, 8],
              [0, 5, 0]])
btw 数组索引从 0 开始
数组切片
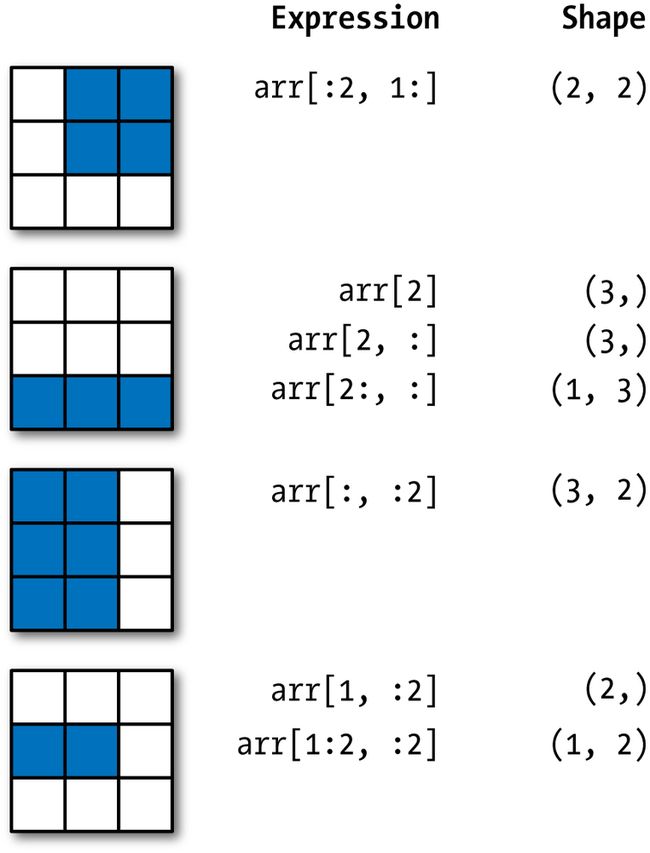
NumPy 中的切片语法:x[start:stop:step],如果没有赋值,默认值 start=0, stop=size of dimension, step=1。
(上图最后一个图形,arr[1, :2] 应该是 (1,2) 一行二列矩阵??)
array([0, 1, 2, 3, 4, 5, 6, 7, 8, 9])

In[]: x[::2]  # every other element

Out[]:array([0, 2, 4, 6, 8])
array([[12,  5,  2,  4],
       [ 7,  6,  8,  8],
       [ 1,  6,  7,  7]])

In[]: x2[:3, ::2]  # all rows, every other column

Out[]:array([[12,  2],
           [ 7,  8],
           [ 1,  7]])
复制数组切片
x2 = array([[99  5  2  4]
            [ 7  6  8  8]
            [ 1  6  7  7])

In[]: x2_sub_copy = x2[:2, :2].copy()
      print(x2_sub_copy)

Out[]:[[99  5]
       [ 7  6]]
数组转置和轴对换
reshape:
In[]: arr = np.arange(15).reshape((3,5))
      arr

Out[]: array([[ 0,  1,  2,  3,  4],
              [ 5,  6,  7,  8,  9],
              [10, 11, 12, 13, 14]])
转置(transpose)是重塑(reshape)的一种特殊形式,返回源数据的视图而不进行复制。
In[]: arr.T

Out[]: array([[ 0,  5, 10],
               [ 1,  6, 11],
               [ 2,  7, 12],
               [ 3,  8, 13],
               [ 4,  9, 14]])
连接和拆分数组
用concatenate连接数组:
In[]: grid = np.array([[1, 2, 3],
                       [4, 5, 6]])
      np.concatenate([grid, grid])

Out[]: array([[1, 2, 3],
              [4, 5, 6],
              [1, 2, 3],
              [4, 5, 6]])
# concatenate along the second axis (zero-indexed)

In[]: np.concatenate([grid, grid], axis=1)

Out[]: array([[1, 2, 3, 1, 2, 3],
               [4, 5, 6, 4, 5, 6]])
用 vstack合并到数据行, hstack 合并到数据列
In[]: x = np.array([1, 2, 3])
      grid = np.array([[9, 8, 7],
                       [6, 5, 4]])

    # vertically stack the arrays
      np.vstack([x, grid])

Out[]:array([[1, 2, 3],
            [9, 8, 7],
            [6, 5, 4]])
拆分数组的函数包括: np.split, np.hsplit, np.vsplit
In[]: x = np.arange(8.0)
      np.split(x, [3, 5, 6, 10])

Out[]:  [array([ 0.,  1.,  2.]),
         array([ 3.,  4.]),
         array([ 5.]),
         array([ 6.,  7.]),
         array([], dtype=float64)]
使用 mask 快速截取数据
传递给数组一个与它有关的条件式,然后它就会返回给定条件下为真的值。
In[]: norm10 = np.random.normal(10,3,5)
      mask = norm10 > 9
      mask

Out[]:array([False,  True, False,  True, False], dtype=bool)
In[]: print('Values above 9:', norm10[mask])

Out[]: ('Values above 9:', array([ 13.69383139,  13.49584954]))
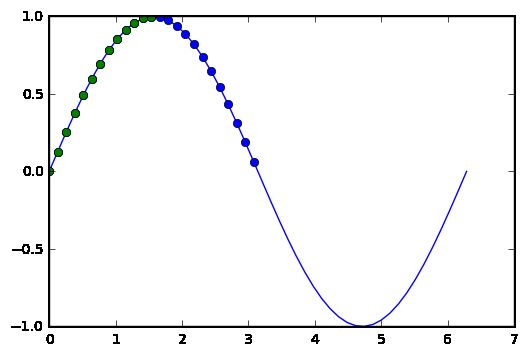
在生成图形时也非常好用:
import matplotlib.pyplot as plt

a = np.linspace(0, 2 * np.pi, 50)
b = np.sin(a)
plt.plot(a,b)
mask = b >= 0
plt.plot(a[mask], b[mask], 'bo')
mask = (b >= 0) & (a <= np.pi / 2)
plt.plot(a[mask], b[mask], 'go')
plt.show()
在程序中用条件式选择了图中不同的点。蓝色的点(也包含图中的绿点,只是绿点覆盖了蓝点),显示的是值大于零的点。绿点显示的是值大于 0 小于 Pi / 2 的点。
广播 Broadcasting
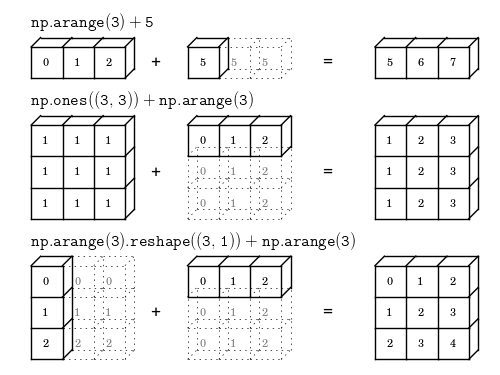
当不同 shape 的数组进行运算(按位加/按位减的运算,而不是矩阵乘法的运算)时,(某个维度上)小的数组就会沿着(同一维度上)大的数组自动填充。广播虽然是一个不错的偷懒办法,但是效率不高、降低运算速度通常也为人诟病。
The term broadcasting describes how numpy treats arrays with different shapes during arithmetic operations. Subject to certain constraints, the smaller array is “broadcast” across the larger array so that they have compatible shapes.
via Broadcasting — NumPy v1.13 Manual
广播的原理(via Broadcast Visualization):
参考资料
- NumPy.org
- Python Data Science Handbook
- 利用Python进行数据分析
- Scipy lecture notes
- Enter The Matrix
- 使用 Python 进行科学计算:NumPy入门
- Broadcasting — NumPy v1.13 Manual
- EricsBroadcastingDoc - SciPy wiki dump
- Broadcast Visualization — astroML 0.2 documentation
Art & Code 的热门文章
- 多用Git少交税
- VR 学习图谱
- 设计师学编程?从五个思维训练开始
- FabAcademy 可以学什么?[FabNotes001]


