之前弄的程序都是将获得的结果打印到终端或者输出到文件里,这样下一次用的时候,要不就要重新运行之前的程序,要不就要重新读取文件获得,不免有点复杂。这次决定学下数据库,使用也方便。Python 自带了sqlite3,直接 import sqlite3 就能用了。
数据库的使用
import sqlite3
conn = sqlite3.connect('test.db')
cursor = conn.cursor()
cursor.execute('create table user (id varchar(20) primary key, name varchar(20))')
cursor.execute('insert into user (id, name) values (\'1\', \'Michael\')')
# 也可以这样插入,用问号代替相应部分内容
# cursor.execute('insert into user(id, name) values (? , ? ) ' , ('1','Michael'))
# 通过rowcount获得插入的行数: 通用来说就是SQL 的 insert update delete 操作影响了的行数
print(cursor.rowcount)
# 关闭Cursor:
cursor.close()
# 提交事务:
conn.commit()
# 关闭Connection:
conn.close()
分清Connection 和 Cursor,SQL 的具体执行都是后者完成。
cursor.execute('select * from user where id=?', ('1',))
# 获得所有查询结果:
values = cursor.fetchall()
# 获得一个查询结果
value = cursor.fetchone()
# 获取指定数值的结果,默认是一个
value = cursor.fetchmany([size=s])
## 如果先获得所有结果再尝试获取一个结果,后来的尝试得到的数据为空
## 如果先获得一个结果再尝试获取所有结果,后来的尝试得到的数据为除去第一个以外的数据
过程出错也要保证关闭了数据库,可以用 try:...except:...finally:...
数据的展现
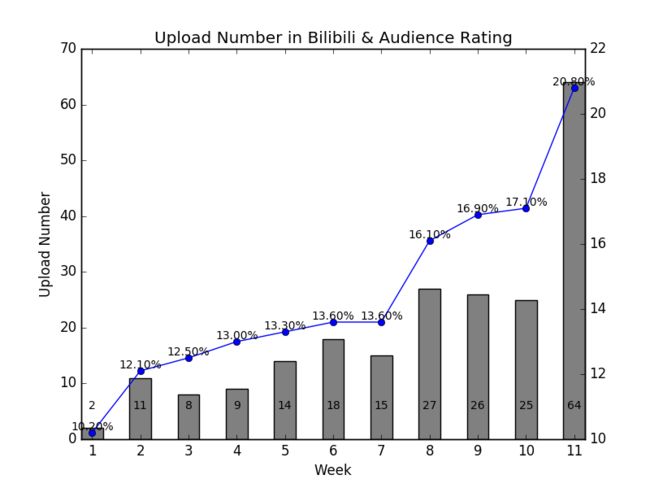
这次是打算获取下某部日剧的收视率与播出后一个星期内 up 主上传视频数之间的比较,用的是折线图表现收视率,柱状图表示上传的视频数目。
Python 画图比较麻烦,而且展示效果不是很美观,下次如果有类似的需要还是尝试下用 excel
画图的代码
import numpy as np
import matplotlib.pyplot as plt

plt.title("Upload Number in Bilibili & Audience Rating")
x = range(1, len(release_count) + 1)
ynum = np.array(release_count)
plt.bar(x, ynum, width=0.5, align="center", color="gray")
plt.xticks(x, x)
for a, b in zip(x, ynum):
    plt.text(a, 5, "%.0f" % (b), ha="center", va="bottom", fontsize=10)
plt.xlabel("Week")
plt.ylabel("Upload Number")

plt2 = plt.twinx()
yrate = np.array(release_rate)
plt2.plot(x, yrate, color="b", linestyle="-", marker="o")
for a, b in zip(x, yrate):
    plt2.text(a, b, "%.2f%%" % b, ha="center", va="bottom", fontsize=10)
plt.show()
最后的效果如下
这里只选取了一个关键词,结果只是能当做参考,可以多加关键词获取更多更准确的数量。
总结
发现自己对于 itertools 和 functools 这两个模块不太熟练,还是要多学习
博客里看代码不是太方便,我 Github 上已经有了,来 这里 看。以后的修改博客就不更了,欢迎关注我的 Github
#!/usr/bin/python3
# -*- coding:utf-8 -*-

import os
import re
import itertools
import sqlite3
from bs4 import BeautifulSoup
import requests
import numpy as np
import matplotlib.pyplot as plt


class Bilibili:

    def __init__(self, name, keywords):
        self.con = sqlite3.connect(name)
        self.db = self.con.cursor()
        self.keywords = keywords

    def crawl(self):
        session = requests.Session()
        types = ['totalrank', 'click', 'pubdate', 'dm', 'stow']

        self.db.execute('''
                create table koi_information
                (id int primary key,
                link text,
                uploader text,
                uploadtime text,
                title text,
                description text,
                duration int,
                watch int,
                dm int)
                ''')
        self.con.commit()

        for keyword in self.keywords:
            page = 1
            typeid = 0

            for tp in types:
                os.mkdir(keyword+" "+tp)

            while typeid < 5:
                search = session.get("https://search.bilibili.com/all?keyword=" +
                                     keyword+"&page="+str(page)+"&order="+types[typeid])
                if search:
                    with open(keyword+" "+types[typeid]+"/"+str(page)+".html", "w") as file:
                        file.write(search.content.decode(encoding="utf-8"))
                if page < 50:
                    page = page + 1
                else:
                    typeid = typeid + 1
                    page = 1

            for tp in types:
                allfile = os.listdir(keyword+" "+tp)
                for file in allfile:
                    with open(keyword+" "+tp+"/"+file, "r") as source:
                        soup = BeautifulSoup(source.read(), "lxml")
                        matrixs = soup.find_all("li", attrs={"class": "video matrix "})
                        for matrix in matrixs:
                            head = matrix.find("a", attrs={"class": "title"})
                            link, vid = self.__href_format(head['href'])
                            title = self.__str_format(head['title'])
                            duration_text = matrix.find("span", attrs={"class": "so-imgTag_rb"}).text
                            duration = self.__to_second(self.__str_format(duration_text))
                            description = self.__str_format(matrix.find("div", attrs={"class": "des hide"}).text)
                            watch_text = matrix.find("span", attrs={"title": "观看"}).text
                            watch = self.__num_format(self.__str_format(watch_text))
                            dm_text = matrix.find("span", attrs={"title": "弹幕"}).text
                            dm = self.__num_format(self.__str_format(dm_text))
                            uploadtime_text = matrix.find("span", attrs={"title": "上传时间"}).text
                            uploadtime = self.__str_format(uploadtime_text)
                            uploader_text = matrix.find("span", attrs={"title": "up主"}).text
                            uploader = self.__str_format(uploader_text)
                            try:
                                print("try saving " + vid)
                                self.db.execute("insert into koi_information values(?,?,?,?,?,?,?,?,?)",
                                                (vid, link, uploader, uploadtime, title,
                                                 description, duration, watch, dm))
                            except Exception as e:
                                print("exist or something wrong : " ,e)
                            self.con.commit()

    def show(self):
        release_date = [
            "2016-10-11", "2016-10-18", "2016-10-25", "2016-11-01", "2016-11-08", "2016-11-15",
            "2016-11-22", "2016-11-29", "2016-12-06", "2016-12-13", "2016-12-20"
        ]

        release_rate = [10.2, 12.1, 12.5, 13.0, 13.3, 13.6, 13.6, 16.1, 16.9, 17.1, 20.8]

        release_count = []
        for val in release_date:
            self.db.execute(
                "select title,uploadtime,link from koi_information "
                "where julianday(uploadtime) - julianday(?) < 7 and julianday(uploadtime) - julianday(?) >= 0",
                (val, val))
            cnt = len(self.db.fetchall())
            release_count.append(cnt)

        diff = 7
        all_count = []
        for val in release_count:
            all_count.append(val)

        while diff < 365:
            self.db.execute(
                "select title,uploadtime,link from koi_information "
                "where julianday(uploadtime) - julianday(?) < ? and julianday(uploadtime) - julianday(?) >= ?",
                (release_date[-1], 7 + diff, release_date[-1], 0 + diff))
            cnt = len(self.db.fetchall())
            all_count.append(cnt)
            diff = diff + 7

        self.db.close()

        plt.title("Upload Number in Bilibili & Audience Rating")
        x = range(1, len(release_count) + 1)
        ynum = np.array(release_count)
        plt.bar(x, ynum, width=0.5, align="center", color="gray")
        plt.xticks(x, x)
        for a, b in zip(x, ynum):
            plt.text(a, 5, "%.0f" % (b), ha="center", va="bottom", fontsize=10)
        plt.xlabel("Week")
        plt.ylabel("Upload Number")

        plt2 = plt.twinx()
        yrate = np.array(release_rate)
        plt2.plot(x, yrate, color="b", linestyle="-", marker="o")
        for a, b in zip(x, yrate):
            plt2.text(a, b, "%.2f%%" % b, ha="center", va="bottom", fontsize=10)
        plt.show()

    @staticmethod
    def __str_format(val):
        if not val:
            return None
        return val.replace("\t", "").replace("\n", "")

    @staticmethod
    def __href_format(val):
        if not val:
            return None
        pattern = re.compile(".*(www.bilibili.com/video/av([0-9]+)).*")
        result = pattern.match(val)
        if result:
            return result.group(1), result.group(2)
        else:
            return None

    @staticmethod
    def __to_second(val):
        if not val:
            return 0
        num = val.split(":")
        ## 这里弄错了,如果 num 里只有两个数字还是对的,一长就错了,自己还是想复杂了,用functools.reduce(lambda x,y : int(x)*60 + int(y),num)
        return int(list(itertools.accumulate(num, lambda a, b: int(a) * 60 + int(b)))[1])


    @staticmethod
    def __num_format(val):
        if not val:
            return 0
        if "万" in val:
            num = val.split("万")
            return int(float(num[0]) * 10000)
        else:
            return int(val)


if __name__ == "__main__":
    b = Bilibili("test.db", ["gakki舞"])
    b.crawl()
    b.show()
来自个人 Python 文集
