[toc]
初衷
曼德布洛特集合是在李善友老师的混沌大学公开课上听到的,在极客学院使用TensorFlow也可以实现该集合,将其可视化时,于是尝试模拟该模型。
参考文档
Numpy、matplotlib实现二维数据到图像的转换,添加colormap,无边距显示:https://blog.csdn.net/u010105243/article/details/76695400
极客学院源码曼德布洛特集合源码(较老):http://wiki.jikexueyuan.com/project/tensorflow-zh/tutorials/mandelbrot.html
源码实现曼德勃罗集合
"""
本案例来展示偏微分方程
使用tensorflow来实现该模型
"""

import tensorflow as tf
import numpy as np

import PIL.Image
import PIL.ImageDraw

import matplotlib.pyplot as plt

def DisplayFractal(a, fmt='jpeg'):
  """显示迭代计算出的彩色分形图像。"""
  a_cyclic = (6.28*a/20.0).reshape(list(a.shape)+[1])
  img = np.concatenate([10+20*np.cos(a_cyclic),
                        30+50*np.sin(a_cyclic),
                        155-80*np.cos(a_cyclic)], 2)
  img[a==a.max()] = 0
  a = img
  a = np.uint8(np.clip(a, 0, 255))
  img1 = PIL.Image.fromarray(a)
  plt.imsave("image_tf.png", img1)
  plt.show()


sess = tf.InteractiveSession()
# 使用NumPy创建一个在[-2,2]x[-2,2]范围内的2维复数数组
Y, X = np.mgrid[-1.3:1.3:0.005, -2:1:0.005]
Z = X+1j*Y

xs = tf.constant(Z.astype("complex64"))
zs = tf.Variable(xs)
ns = tf.Variable(tf.zeros_like(xs, "float32"))
tf.global_variables_initializer().run()

# 计算一个新值z: z^2 + x
zs_ = zs*zs + xs

# 这个新值会发散吗?
not_diverged = tf.abs(zs_) < 4

# 更新zs并且迭代计算。
#
# 说明:在这些值发散之后,我们仍然在计算zs,这个计算消耗特别大!
#      如果稍微简单点,这里有更好的方法来处理。
#
step = tf.group(
  zs.assign(zs_),
  ns.assign_add(tf.cast(not_diverged, "float32"))
  )

for i in range(200):
    step.run()

DisplayFractal(ns.eval())
这里对wiki上的源码做了三处改动
1. import matplotlib.pyplot as plt

使用plt绘制二维数组图

2.  img1 = PIL.Image.fromarray(a)
    plt.imsave("image_tf.png", img1)

用plt绘图,而不是IPython.display

3. # 这个新值会发散吗?
not_diverged = tf.abs(zs_) < 4

原函数tf.complex_abs已经在新版tf中弃用。
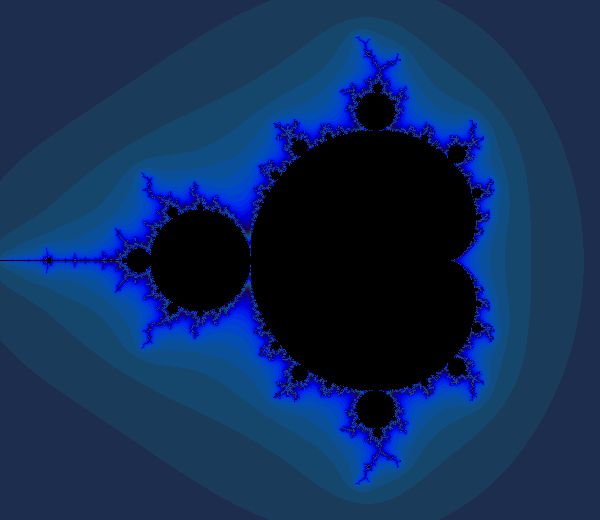
结果如下,在当前目录下生成一张图片image_tf.png:
后记
还有其他绘制曼德勃罗集合的方式,这里就不展开了。
"""
本案例用来展示曼德布洛特迭代模型.
使用纯粹的python 算法实现该模型, machine_10 使用tensorflow来实现该模型
绘图使用PIL
"""

import time
from PIL import Image, ImageDraw

g_size = (400, 300) # 图形最终尺寸
g_max_iteration = 256 # 最大迭代次数
g_bailout = 4 # 最大域
g_zoom = 2.5 / g_size[0] # 缩放参数
g_offset = (-g_size[0] * 0.25, 0) # 偏移量
g_HSL = (210, 80, 50) # HSL色彩基调

def draw(antialias = True):
    zi = 2 if antialias else 1 # antialias: 抗锯齿 size = [i * zi
    size = [i * zi for i in g_size]
    zoom = g_zoom / zi
    offset = [i * zi  for i in g_offset]
    bailout = g_bailout * zi
    img = Image.new("RGB", size, 0xffffff)
    dr = ImageDraw.Draw(img)

    print("painting Mandelbrot Set..")
    for xy, color in getPoints(size, offset, zoom):
        dr.point(xy, fill = color)
    print("100%n")

    del dr
    if antialias:
        img = img.resize(g_size, Image.ANTIALIAS)
    img.show()
    img.save("mandelbrot_set_%dx%d.png" % g_size)

def getPoints(size, offset, zoom, ti = 0, tstep = 1):
    "生成需要绘制的点的坐标及颜色"

    def getRepeats(c):
        z = c
        repeats = 0
        while abs(z) < g_bailout and repeats < g_max_iteration:
            z = z * z + c
            repeats += 1
        return repeats

    def getColor(r):
        color = "hsl(0, 0%, 0%)"
        if r < g_max_iteration:
            v = 1.0 * r / g_max_iteration
            h = ch * (1 - v)
            s = cs
            l = cl * (1 + v)
            color = "hsl(%d, %d%%, %d%%)" % (h, s, l)
        return color

    xs, ys = size
    xw, yh = xs / 2, ys / 2
    xo, yo = offset
    ch, cs, cl = g_HSL

    progress = 0
    for iy in range(ys):
        p = iy * 100 / ys
        if iy % 10 == 0 and p != progress:
            print ("%d%%..." % p) # 显示进度
            progress = p
        for ix in range(ti, xs, tstep):
            x = (ix - xw + xo) * zoom
            y = (iy - yh + yo) * zoom
            c = complex(x, y)
            r = getRepeats(c)
            yield (ix, iy), getColor(r)

def main():
    t0 = time.time()
    draw()
    t = time.time() - t0
    print("%dm%.3fs" % (t / 60, t % 60))

if __name__ == "__main__":
    main()
