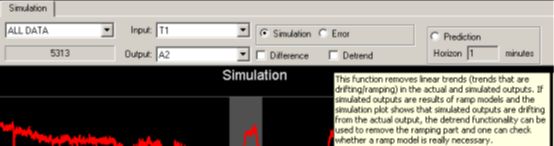
•去除线性趋势—从仿真或预测数据以及错误数据中删除线性趋势。该选项允许检查实际输出数据的变化是否仍然被仿真或预测输出所捕获,否则输出模型就是不好的。当选中detrend复选框时,将计算线性回归模型,并从实际数据中减去由线性回归模型仿真的数据。目前线性回归模型不是为某个数据段计算的,而是为整个数据计算的。Detrend选项适用于FIR,F2P和PAR模型的输出。

仿真窗口字段
Segments(数据段):包含所有工作区数据段的下拉列表。
Input(输入):在预测图上部子图中趋势的输入位号。
Output(输出):绘制输出及其预测。
Sample Time(采样时间):当前光标所处位置的采样时间。
Simulation / Error /Prediction(仿真/误差/预测):这些单选按钮控制图形是否显示仿真、误差或预测结果。
Detrend(去除线性趋势):若选中此项,拟合输出(仿真,预测,差分数据,误差或所有这些选项的组合)将被去除线性趋势。
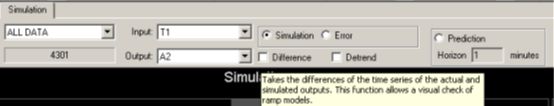
Difference(差分):若选中此项,输出的时间序列和拟合输出会有差异。差分对于评估斜坡模型的拟合度非常有用。
图例表
Show(显示):若选中此项,相应的模型预测将显示在预测图上。
Color(颜色):双击以修改预测图线的颜色;此线条颜色也对应于overlay和FIR fit窗口中的线条颜色。
Name(名称):位号/预测模型源的名称。
Description(描述):位号/模型源描述。
Units(单位):位号单位。
New Value(新值):最后单击的垂直游标线处的位号/预测值。将鼠标移到趋势线上,然后单击鼠标左键。将生成一条垂直光标线,并且此列将填充相应采样时间的位号值。
Old Value(旧值):当鼠标移动并再次点击趋势时,先前单击的采样时间的值将放置在此列中。
Plot MIN:趋势的Y轴低限值。该值可以手动更改,也可以使用 Auto-scale(自动缩放), Common-scale(共同缩放), Scale with Common Range(公共范围缩放)趋势缩放选项。请注意,所有拟合共享相同的缩放值。
Plot MAX:趋势的Y轴高限值。该值可以手动更改,也可以使用 Auto-scale(自动缩放), Common-scale(共同缩放), Scale with Common Range(公共范围缩放)趋势缩放选项。请注意,所有拟合共享相同的缩放值。
提示
Fit Groups Analysis/Simulation(拟合组分析/仿真)选项卡中为以下功能提供了提示:
差分
去除线性趋势
预测

原文:
• Detrend – Remove the linear trend from the simulated or predicted data as well as the error data. This option allows one to check whether the variations of the actual output data are still captured in the simulated or predicted output, although the output model is not good. When the detrend checkbox is checked, a linear regression model will be calculated and the data simulated by the linear regression model will be subtracted from the actual data. Currently, the linear regression model is not calculated for each data segment, but it is calculated for the whole data. Detrend option applies to the output of the FIR, F2P, and PAR models.
Simulation Window Fields
**Segments: **Drop down list with all the workspace segments.
**Input: **Input tag trended in upper subplot of prediction plot.
**Output: **Output and its predictions to be plotted.
**Sample Time: **Sample time of current cursor position.
Simulation / Error /Prediction: These radio buttons control whether the plots show simulation, error or prediction results.
Detrend: If checked, the fit output (either simulated, predicted, differenced data, error or the combination of all these options) will be detrended.
Difference: If checked, the time series of the output and the fit output are both differenced. Differencing is very useful for assessing the goodness of fit for ramp models.
Legend Table
Show: If checked, the corresponding model prediction is shown on the predictions plot.
**Color: **Double-click to modify the prediction plot line color; this line color also corresponds to the line colors in the overlay and FIR fit windows.
**Name: **Name of the tag/prediction model source.
**Description: **Tag/model source description.
Units: Tag units.
**New Value: **Tag/prediction values at the last clicked vertical cursor line. Move the mouse over a trend line and click the left mouse button. This results in the vertical cursor line and this column gets populated with the values of the tags at the corresponding sample time.
**Old Value: **When the mouse is moved and clicked again over a trend, the values at the previously clicked sample time get placed in this column.
**Plot MIN: **Lower Y-axis value for trend. This value can be changed manually and by using the Auto-scale, Common-scale, Scale with Common Range trend scaling options. Note that all the fits share the same scale values.
**Plot MAX: **Upper Y-axis value for tag trend. This value can be changed manually and by using the Auto-scale, Common-scale and Range with Common Scale trend scaling options. Note that all the fits share the same scale values.
Tooltips
Tooltips are available for the following features in Fit Groups Analysis/Simulation Tab:
Difference
Detrend
Prediction
2016.11.27