作者:白介素2
相关阅读:
[R语言生存分析03-Cox比例风险模型]
R语言生存分析-02-ggforest
R语言生存分析-01
ggpubr-专为学术绘图而生(二)
ggstatsplot-专为学术绘图而生(一)
生存曲线
R语言GEO数据挖掘01-数据下载及提取表达矩阵
R语言GEO数据挖掘02-解决GEO数据中的多个探针对应一个基因
R语言GEO数据挖掘03-limma分析差异基因
R语言GEO数据挖掘04-功能富集分析
如果没有时间精力学习代码,推荐了解:零代码数据挖掘课程
Cox比例风险模型
- The Cox proportional-hazards model (Cox, 1972) Cox比例风险模型是常用与医学研究中的回归模型,通常用于研究预测变量与生存时间的关系
- Kaplan-Meier curves 与 logrank test tests属于单因素分析的例子,他们研究的是单一变量与生存的关系,并且Kaplan-Meier 与log-rank检验只适用于分类变量,却并不适用于数值型变量,比如我们常见的基因表达
- Cox比例风险回归分析的优势在于可以分析分类变量与数值变量,并且将生存分析的范围由单因素拓展到多因素的分析.
Cox比例风险模型基础知识
- 在临床研究中,存在许多情况,其中几个已知量(称为协变量)可能影响患者预后。
- 例如,假设比较两组患者:具有和没有特定基因型的患者。如果其中一组也包含较老的个体,则存活率的任何差异可归因于基因型或年龄或两者。因此,在研究与任何一个因素相关的生存时,通常需要调整其他因素的影响。
- 统计模型是一种常用工具,可以同时分析几个因素的生存。另外,统计模型提供每个因素的效果大小。
- cox比例风险模型是用于对生存分析数据建模的最重要方法之一。
- 该模型的目的是同时评估几个因素对生存的影响。换句话说,它允许我们检查特定因素如何影响特定时间点发生的特定事件(例如,感染,死亡)的发生率。这个比率通常被称为危险率。 预测变量(或因子)通常在生存分析文献中称为协变量。
h(t)=h0(t)×exp(b1x1+b2x2+...+bpxp)公式可以描述为t代表生存时间,h(t)是风险函数,由协变量x1,x2,x3等决定,b1,b2,b3等代表的是协变量的系数,即该变量对生存时间影响的大小,h0(t)表示的是基线风险
exp(bi)指的是Hazard Ratio,HR,
- HR = 1: 无效应
- HR < 1: 风险减少
- HR > 1: 风险增加
实例代码演示
Sys.setlocale('LC_ALL','C')
library("survival")
library("survminer")
计算风险模型的函数 coxph()
survival::coxph(formula, data, method)
formula是带有生存对象的线性模型,生存对象用Surv(time,event)
data是带有协变量的数据框,method是方法,一般默认efron
加载实例数据集
data("lung")
head(lung)
##   inst time status age sex ph.ecog ph.karno pat.karno meal.cal wt.loss
## 1    3  306      2  74   1       1       90       100     1175      NA
## 2    3  455      2  68   1       0       90        90     1225      15
## 3    3 1010      1  56   1       0       90        90       NA      15
## 4    5  210      2  57   1       1       90        60     1150      11
## 5    1  883      2  60   1       0      100        90       NA       0
## 6   12 1022      1  74   1       1       50        80      513       0
单因素Cox回归分析
res.cox <- coxph(Surv(time, status) ~ sex, data = lung)
res.cox

## Call:
## coxph(formula = Surv(time, status) ~ sex, data = lung)
##
##        coef exp(coef) se(coef)      z       p
## sex -0.5310    0.5880   0.1672 -3.176 0.00149
##
## Likelihood ratio test=10.63  on 1 df, p=0.001111
## n= 228, number of events= 165
生成完整的结果报告
summary(res.cox)
## Call:
## coxph(formula = Surv(time, status) ~ sex, data = lung)
##
##   n= 228, number of events= 165
##
##        coef exp(coef) se(coef)      z Pr(>|z|)
## sex -0.5310    0.5880   0.1672 -3.176  0.00149 **
## ---
## Signif. codes:  0 '***' 0.001 '**' 0.01 '*' 0.05 '.' 0.1 ' ' 1
##
##     exp(coef) exp(-coef) lower .95 upper .95
## sex     0.588      1.701    0.4237     0.816
##
## Concordance= 0.579  (se = 0.021 )
## Likelihood ratio test= 10.63  on 1 df,   p=0.001
## Wald test            = 10.09  on 1 df,   p=0.001
## Score (logrank) test = 10.33  on 1 df,   p=0.001
str(summary(res.cox))##是一个list
## List of 14
##  $ call        : language coxph(formula = Surv(time, status) ~ sex, data = lung)
##  $ fail        : NULL
##  $ na.action   : NULL
##  $ n           : int 228
##  $ loglik      : num [1:2] -750 -745
##  $ nevent      : num 165
##  $ coefficients: num [1, 1:5] -0.53102 0.588 0.16718 -3.17638 0.00149
##   ..- attr(*, "dimnames")=List of 2
##   .. ..$ : chr "sex"
##   .. ..$ : chr [1:5] "coef" "exp(coef)" "se(coef)" "z" ...
##  $ conf.int    : num [1, 1:4] 0.588 1.701 0.424 0.816
##   ..- attr(*, "dimnames")=List of 2
##   .. ..$ : chr "sex"
##   .. ..$ : chr [1:4] "exp(coef)" "exp(-coef)" "lower .95" "upper .95"
##  $ logtest     : Named num [1:3] 10.6336 1 0.00111
##   ..- attr(*, "names")= chr [1:3] "test" "df" "pvalue"
##  $ sctest      : Named num [1:3] 10.32515 1 0.00131
##   ..- attr(*, "names")= chr [1:3] "test" "df" "pvalue"
##  $ rsq         : Named num [1:2] 0.0456 0.9986
##   ..- attr(*, "names")= chr [1:2] "rsq" "maxrsq"
##  $ waldtest    : Named num [1:3] 10.09 1 0.00149
##   ..- attr(*, "names")= chr [1:3] "test" "df" "pvalue"
##  $ used.robust : logi FALSE
##  $ concordance : Named num [1:2] 0.5786 0.0207
##   ..- attr(*, "names")= chr [1:2] "C" "se(C)"
##  - attr(*, "class")= chr "summary.coxph"
结果解释
- Statistical significance:z给出的是waldtest的统计量,它对应于每个回归系数与其标准误差的比率(z = coef/se(coef)。wald统计量评估给定变量的β(β)系数是否在统计学上显着不同于0从上面的输出,我们可以得出结论,变量性别具有高度统计上显著的系数。
- coef: regression coefficients,回归系数,coef正值表示高风险,在R中HR值是给出第二组与第一组的比值,比如这里的coef=-0.53意味着female Vs. male 95%CI: lower upper
- 整体统计学意义: 最后,输出给出了模型总体显着性的三个替代测试的p值:似然比检验,Wald检验和得分数据统计.这三种方法是渐近等价的.对于足够大的N,它们将给出类似的结果。 对于小N,它们可能有所不同。对于小样本量,似然比检验具有更好的行为,因此通常是优选的。
批量进行单因素Cox生存分析
配合lapply函数进行批量分析,写出单因素批量分析的函数
covariates <- c("age", "sex", "ph.karno", "ph.ecog", "wt.loss")
得到一个列表分别为,对每个变量构建的生存对象公式
univ_formulas <- sapply(covariates,
                        function(x) as.formula(paste('Surv(time, status)~', x)))
univ_formulas
## $age
## Surv(time, status) ~ age
##
##
## $sex
## Surv(time, status) ~ sex
##
##
## $ph.karno
## Surv(time, status) ~ ph.karno
##
##
## $ph.ecog
## Surv(time, status) ~ ph.ecog
##
##
## $wt.loss
## Surv(time, status) ~ wt.loss
##
巧妙的配合lapply
univ_models <- lapply( univ_formulas, function(x){coxph(x, data = lung)})
univ_models
## $age
## Call:
## coxph(formula = x, data = lung)
##
##         coef exp(coef) se(coef)     z      p
## age 0.018720  1.018897 0.009199 2.035 0.0419
##
## Likelihood ratio test=4.24  on 1 df, p=0.03946
## n= 228, number of events= 165
##
## $sex
## Call:
## coxph(formula = x, data = lung)
##
##        coef exp(coef) se(coef)      z       p
## sex -0.5310    0.5880   0.1672 -3.176 0.00149
##
## Likelihood ratio test=10.63  on 1 df, p=0.001111
## n= 228, number of events= 165
##
## $ph.karno
## Call:
## coxph(formula = x, data = lung)
##
##               coef exp(coef)  se(coef)     z       p
## ph.karno -0.016448  0.983686  0.005854 -2.81 0.00496
##
## Likelihood ratio test=7.56  on 1 df, p=0.005966
## n= 227, number of events= 164
##    (1 observation deleted due to missingness)
##
## $ph.ecog
## Call:
## coxph(formula = x, data = lung)
##
##           coef exp(coef) se(coef)     z        p
## ph.ecog 0.4759    1.6095   0.1134 4.198 2.69e-05
##
## Likelihood ratio test=17.57  on 1 df, p=2.773e-05
## n= 227, number of events= 164
##    (1 observation deleted due to missingness)
##
## $wt.loss
## Call:
## coxph(formula = x, data = lung)
##
##             coef exp(coef) se(coef)     z     p
## wt.loss 0.001319  1.001320 0.006079 0.217 0.828
##
## Likelihood ratio test=0.05  on 1 df, p=0.8289
## n= 214, number of events= 152
##    (14 observations deleted due to missingness)
提取出分析结果
- 创建提取批量分析结果的函数
- 提取分析结果,转换为数据框输出 注意是列表元素的提取,
- exp(coef)指的是HR,beta值是系数
univ_results <- lapply(univ_models,
                       function(x){
                          x <- summary(x)
                          p.value<-signif(x$wald["pvalue"], digits=2)
                          wald.test<-signif(x$wald["test"], digits=2)
                          beta<-signif(x$coef[1], digits=2);#coeficient beta
                          HR <-signif(x$coef[2], digits=2);#exp(beta)
                          HR.confint.lower <- signif(x$conf.int[,"lower .95"],2)
                          HR.confint.upper <- signif(x$conf.int[,"upper .95"],2)
                          HR <- paste0(HR, " (",
                                       HR.confint.lower, "-", HR.confint.upper, ")")
                          res<-c(beta, HR, wald.test, p.value)
                          names(res)<-c("beta", "HR (95% CI for HR)",           "wald.test", "p.value")
                          return(res)
                          #return(exp(cbind(coef(x),confint(x))))
                         })
class(univ_results)
## [1] "list"
str(univ_results)
## List of 5
##  $ age     : Named chr [1:4] "0.019" "1 (1-1)" "4.1" "0.042"
##   ..- attr(*, "names")= chr [1:4] "beta" "HR (95% CI for HR)" "wald.test" "p.value"
##  $ sex     : Named chr [1:4] "-0.53" "0.59 (0.42-0.82)" "10" "0.0015"
##   ..- attr(*, "names")= chr [1:4] "beta" "HR (95% CI for HR)" "wald.test" "p.value"
##  $ ph.karno: Named chr [1:4] "-0.016" "0.98 (0.97-1)" "7.9" "0.005"
##   ..- attr(*, "names")= chr [1:4] "beta" "HR (95% CI for HR)" "wald.test" "p.value"
##  $ ph.ecog : Named chr [1:4] "0.48" "1.6 (1.3-2)" "18" "2.7e-05"
##   ..- attr(*, "names")= chr [1:4] "beta" "HR (95% CI for HR)" "wald.test" "p.value"
##  $ wt.loss : Named chr [1:4] "0.0013" "1 (0.99-1)" "0.05" "0.83"
##   ..- attr(*, "names")= chr [1:4] "beta" "HR (95% CI for HR)" "wald.test" "p.value"
res <- t(as.data.frame(univ_results, check.names = FALSE))
as.data.frame(res)
##            beta HR (95% CI for HR) wald.test p.value
## age       0.019            1 (1-1)       4.1   0.042
## sex       -0.53   0.59 (0.42-0.82)        10  0.0015
## ph.karno -0.016      0.98 (0.97-1)       7.9   0.005
## ph.ecog    0.48        1.6 (1.3-2)        18 2.7e-05
## wt.loss  0.0013         1 (0.99-1)      0.05    0.83
通过单因素分析我们得出age,sex,ph.ecog,ph.karno具有统计学意义,由于wt.loss变量无统计学意义,我们在接下来的多因素Cox回归分析中跳过改变量,将四个变量纳入进入分析. 多因素分析回答的是,这些因素如何共同影响生存时间
多因素Cox回归
res.cox <- coxph(Surv(time, status) ~ age + sex + ph.ecog + ph.karno, data =  lung)
res.cox
## Call:
## coxph(formula = Surv(time, status) ~ age + sex + ph.ecog + ph.karno,
##     data = lung)
##
##               coef exp(coef)  se(coef)      z        p
## age       0.012868  1.012951  0.009404  1.368 0.171226
## sex      -0.572802  0.563943  0.169222 -3.385 0.000712
## ph.ecog   0.633077  1.883397  0.176034  3.596 0.000323
## ph.karno  0.012558  1.012637  0.009514  1.320 0.186842
##
## Likelihood ratio test=31.27  on 4 df, p=2.695e-06
## n= 226, number of events= 163
##    (2 observations deleted due to missingness)
summary(res.cox)
## Call:
## coxph(formula = Surv(time, status) ~ age + sex + ph.ecog + ph.karno,
##     data = lung)
##
##   n= 226, number of events= 163
##    (2 observations deleted due to missingness)
##
##               coef exp(coef)  se(coef)      z Pr(>|z|)
## age       0.012868  1.012951  0.009404  1.368 0.171226
## sex      -0.572802  0.563943  0.169222 -3.385 0.000712 ***
## ph.ecog   0.633077  1.883397  0.176034  3.596 0.000323 ***
## ph.karno  0.012558  1.012637  0.009514  1.320 0.186842
## ---
## Signif. codes:  0 '***' 0.001 '**' 0.01 '*' 0.05 '.' 0.1 ' ' 1
##
##          exp(coef) exp(-coef) lower .95 upper .95
## age         1.0130     0.9872    0.9945    1.0318
## sex         0.5639     1.7732    0.4048    0.7857
## ph.ecog     1.8834     0.5310    1.3338    2.6594
## ph.karno    1.0126     0.9875    0.9939    1.0317
##
## Concordance= 0.632  (se = 0.025 )
## Likelihood ratio test= 31.27  on 4 df,   p=3e-06
## Wald test            = 30.61  on 4 df,   p=4e-06
## Score (logrank) test = 31.06  on 4 df,   p=3e-06
可视化生存时间分布
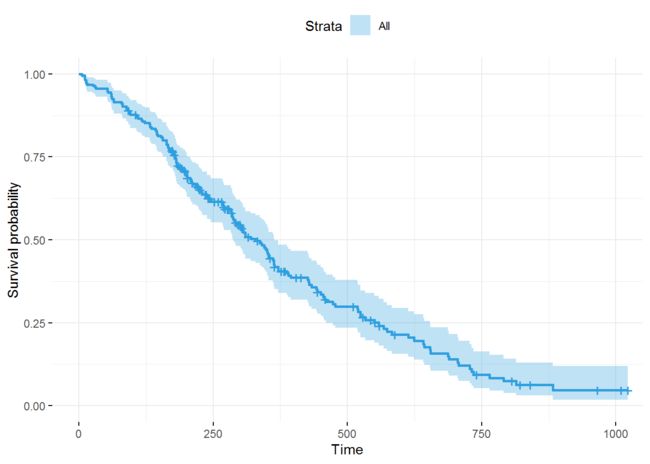
survfit() 用于评估生存比例,默认各协变量的平均值 可视化基线生存时间分布
survfit(res.cox)
## Call: survfit(formula = res.cox)
##
##       n  events  median 0.95LCL 0.95UCL
##     226     163     329     286     364
ggsurvplot(survfit(res.cox),data = lung, color = "#2E9FDF",
           ggtheme = theme_minimal())
## Warning: Now, to change color palette, use the argument palette= '#2E9FDF'
## instead of color = '#2E9FDF'
展示感兴趣的变量如何影响生存分布
原文中的教程较复杂,且并可行,这里我只用自己的简单方法
构建surfut生存对象,与感兴趣的变量建立公式
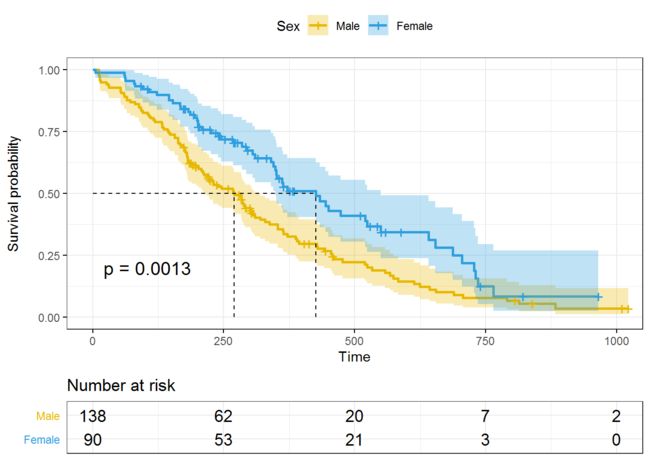
fit<- survfit(Surv(time, status) ~ sex, data = lung)
fit
##
##Call: survfit(formula = Surv(time, status) ~ sex, data = lung)

##       n events median 0.95LCL 0.95UCL
##sex=1 138    112    270     212     310
##sex=2  90     53    426     348     550
##
绘制简单的曲线非常简单::ggsurvplot函数
ggsurvplot(fit, data = lung)
深度定制,这个前几期的内容似乎已经涉及了,就不再重复了
ggsurvplot(fit, data = lung,
 surv.median.line = "hv", # Add medians survival

 # Change legends: title & labels
 legend.title = "Sex",
 legend.labs = c("Male", "Female"),
 # Add p-value and tervals
 pval = TRUE,

 conf.int = TRUE,
 # Add risk table
 risk.table = TRUE,
 tables.height = 0.2,
 tables.theme = theme_cleantable(),

 # Color palettes. Use custom color: c("#E7B800", "#2E9FDF"),
 # or brewer color (e.g.: "Dark2"), or ggsci color (e.g.: "jco")
 palette = c("#E7B800", "#2E9FDF"),
 ggtheme = theme_bw() # Change ggplot2 theme
)
本期内容就到这里,我是白介素2,下期再见
参考资料链接


