title: "thematic map"
author: "wintryheart"
date: "2019/8/16"
output:
html_document:
toc: true
number_sections: true
toc_depth: 1
## ----echo=FALSE----------------------------------------------------------
knitr::opts_chunk$set( warning = FALSE, message = FALSE, echo = TRUE)

knitr::knit_hooks$set(margin = function(before, options, envir){
  if (before){
    par(mar=c(0.1,0.1,1.3,0.1))
  }
})
cartography专题地图包简介
cartography包要配合sf包或sp包使用,即,cartography包调用sf或sp格式的空间数据,生成专题地图。
由于cartography包的大部分内在组件都依赖sf空间功能,所以首先空间对象是sf格式。
-
cartography包自带martinique地图(马提尼克,拉丁美洲向风群岛中部法属岛屿,首府法兰西堡)和数据。
- shp格式(shape/martinique.shp),
- 地理包gpkg格式(gpkg/mtq.gpkg),包含空间数据和专题数据。
- 其他数据csv格式(csv/mob.csv)
- 示例文件(doc/cartography.html)
主函数类别
Symbology系列
每个函数代表一种专题,例如,比例符号(proportional symbols)或 面量图(等值线、地区分布图)(choropleth),然后显示在地图上。
允许将每个专题展示作为一个图层,并在同一地图上叠加展示。
-
每个函数都有两个主参数:
- x,空间对象,一般是sf对象。
- var, 映射的变量名。
-
sp对象可以通过spdf参数和df参数处理。
- 如果变量包含进Spatial*DataFrame,使用spdf参数;
- 如果变量在独立的data.frame,需要并入Spatial*DataFrame,则使用spdf, spdfid, df, dfid参数。
-
还有很多参数用于调节专题地图展示效果,这些参数也是GIS和自动制图工具中常见的参数。
- classification and color palettes 用于面量图(choropleth maps)
- symbols sizes 用于比例符号地图( proportional symbols maps)
| 专题类型 | 函数 |
|---|---|
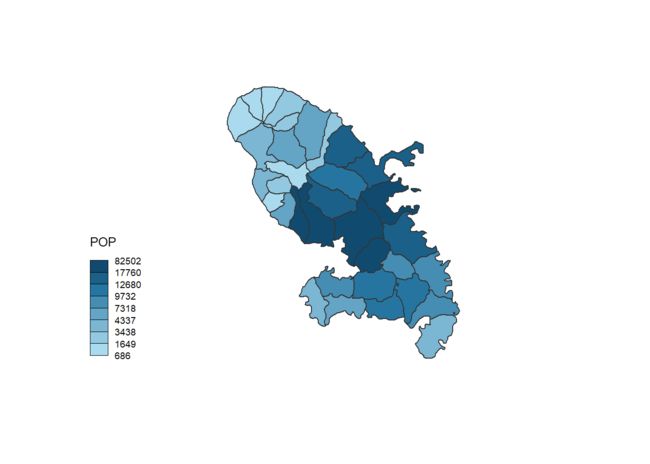
| Choropleth面量图 | choroLayer(x = mtq, var = "myvar", method = "quantile", nclass = 8) |
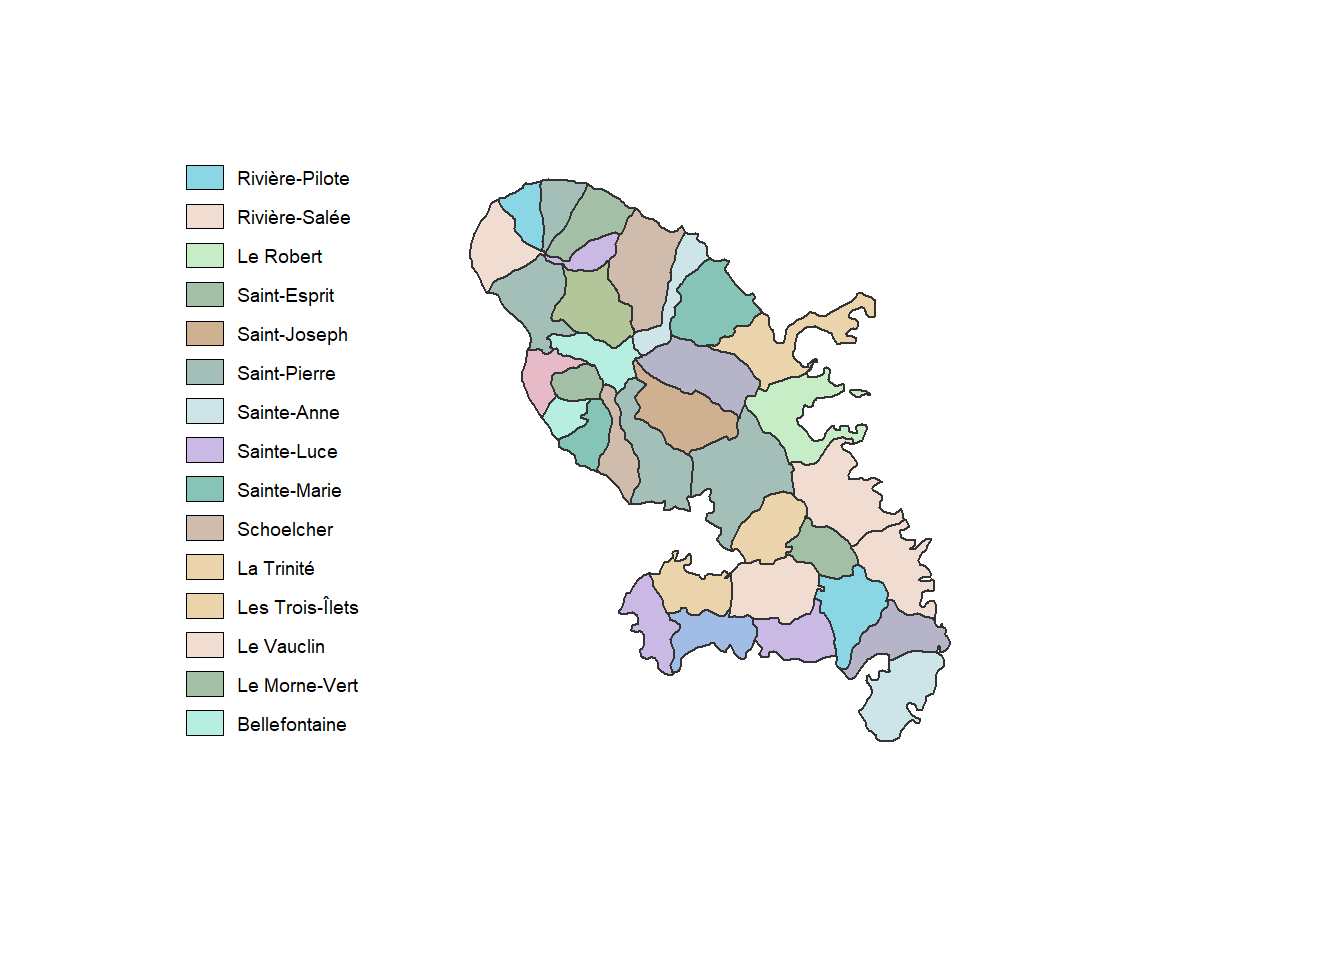
| Typology类型图 | typoLayer(x = mtq, var = "myvar") |
| Proportional Symbols比例符号图 | propSymbolsLayer(x = mtq, var = "myvar", inches = 0.1, symbols = "circle") |
| Colorized Proportional Symbols (relative data) 彩色的比例符号图(相关数据) |
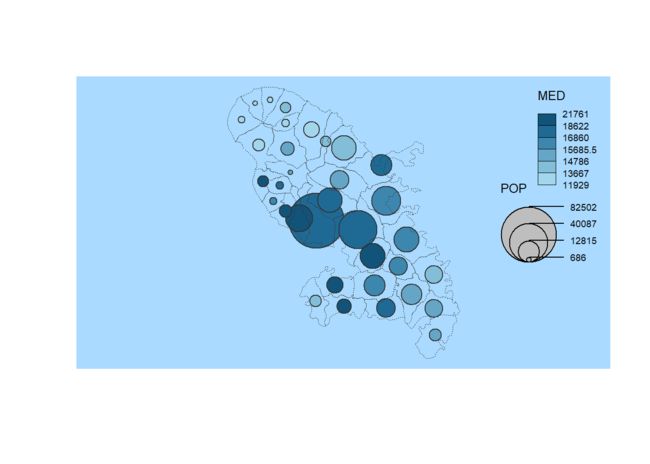
propSymbolsChoroLayer(x = mtq, var = "myvar", var2 = "myvar2") |
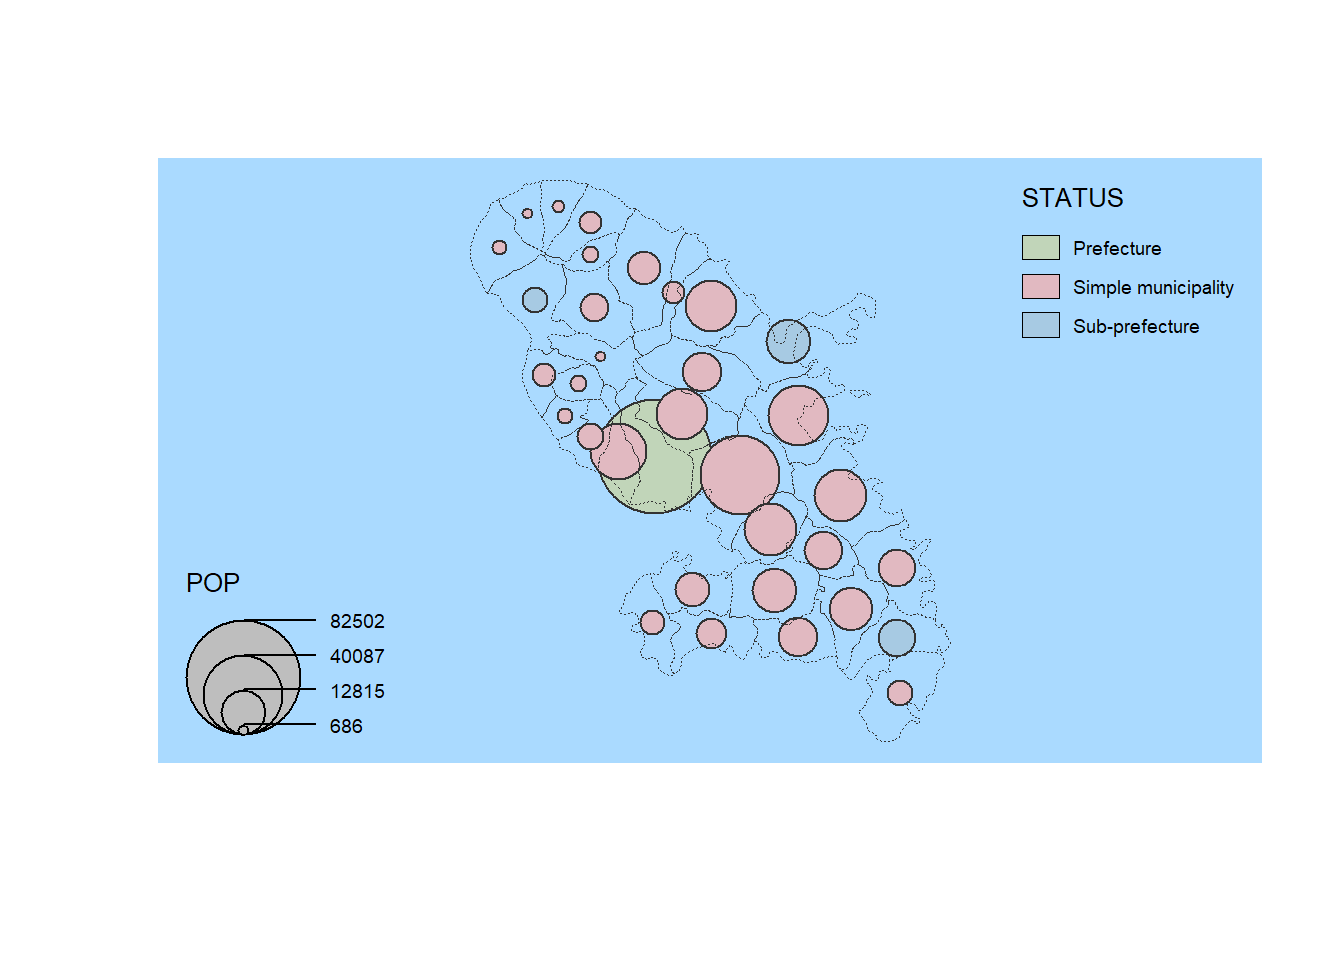
| Colorized Proportional Symbols (qualitative data)彩色的比例符号图(定性数据) | propSymbolsTypoLayer(x = mtq, var = "myvar", var2 = "myvar2") |
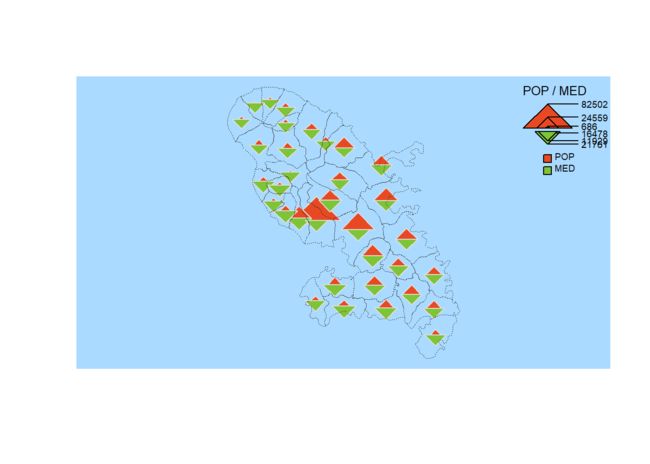
| Double Proportional Symbols双比例符号图 | propTrianglesLayer(x = mtq, var1 = "myvar", var2 = "myvar2") |
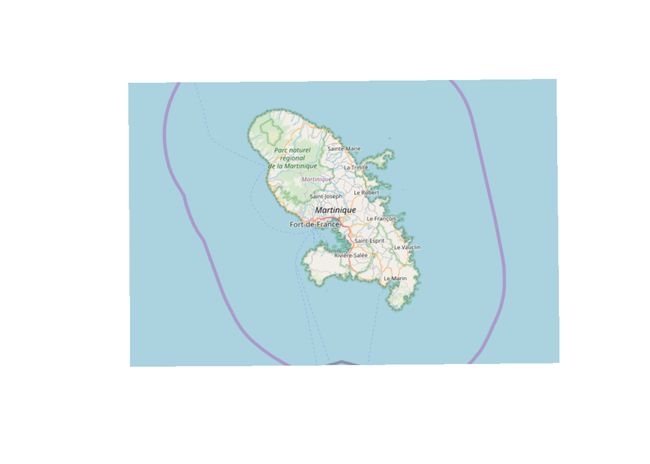
| OpenStreetMap Basemap (see rosm package) OpenStreetMap基础图 |
tiles <- getTiles(x = mtq, type = "osm") tilesLayer(tiles) |
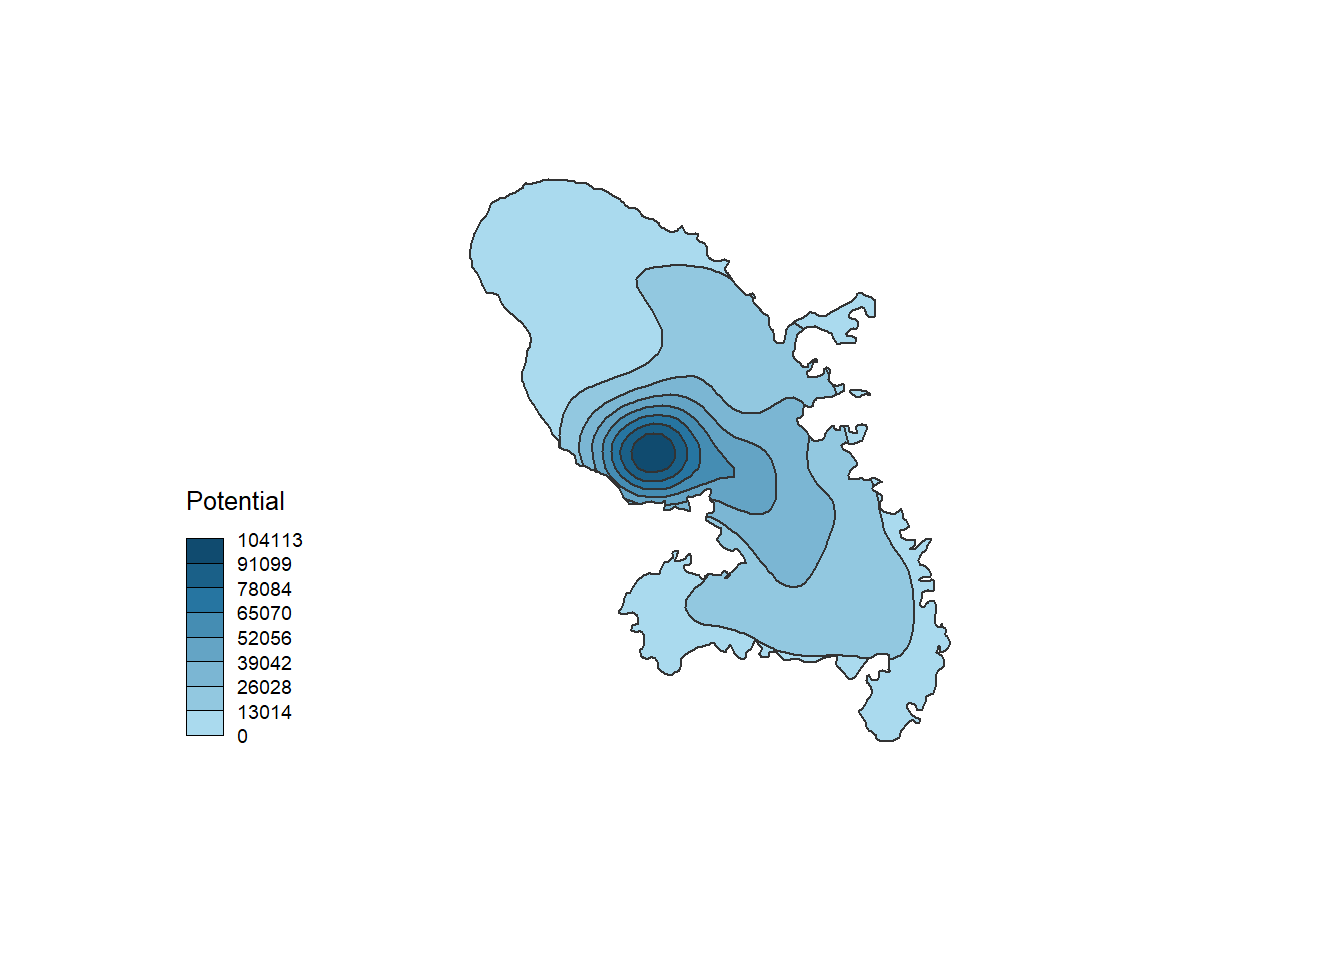
| Isopleth (see SpatialPosition package)等值线图 | smoothLayer(x = mtq, var = "myvar", typefct = "exponential", span = 500, beta = 2) |
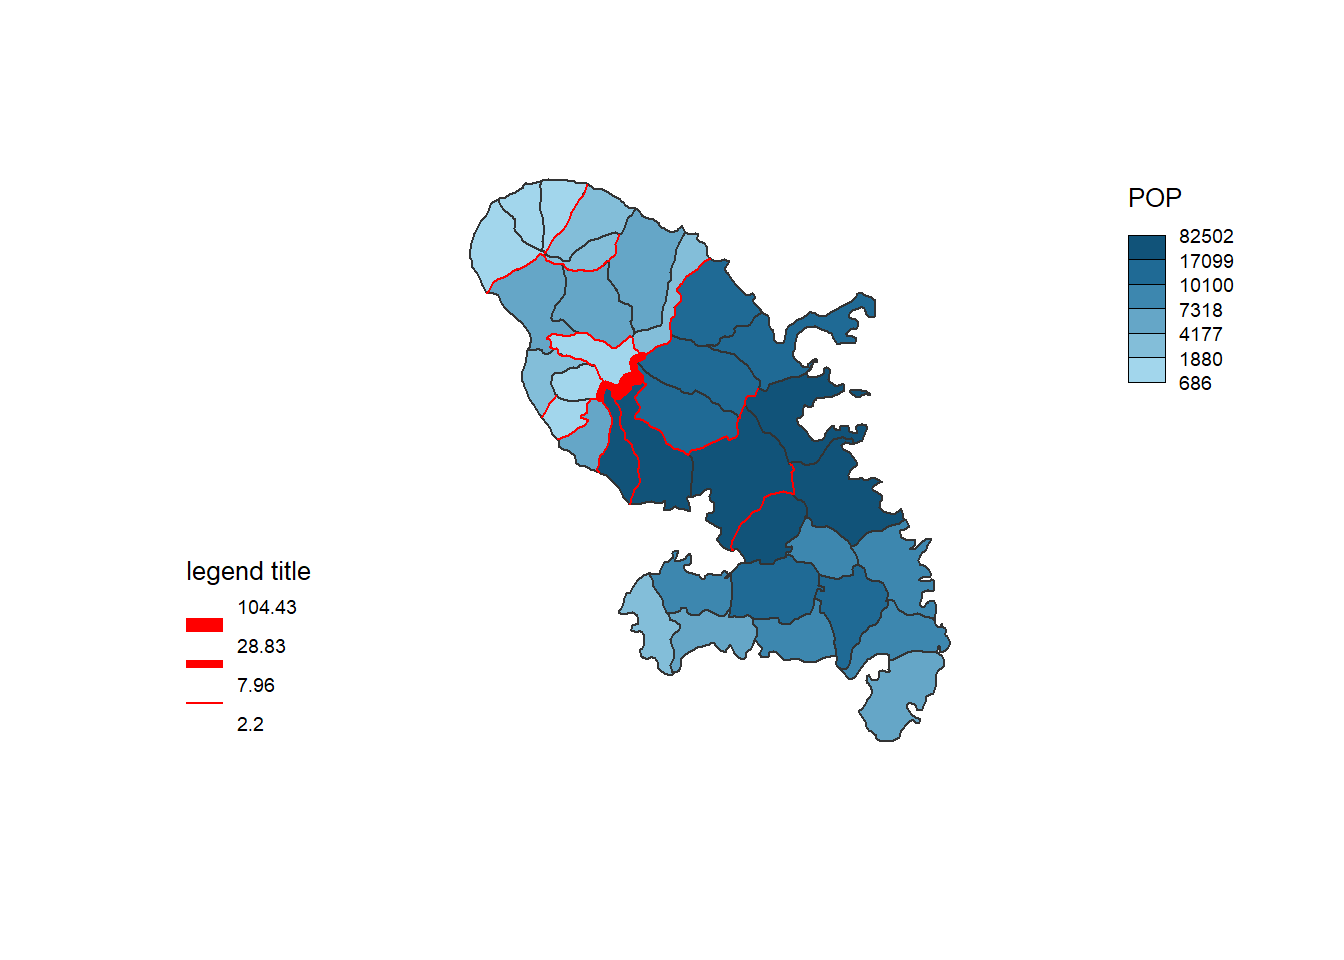
| Discontinuities断裂图 | discLayer(x = mtq.borders, df = mtq, var = "myvar", threshold = 0.5 |
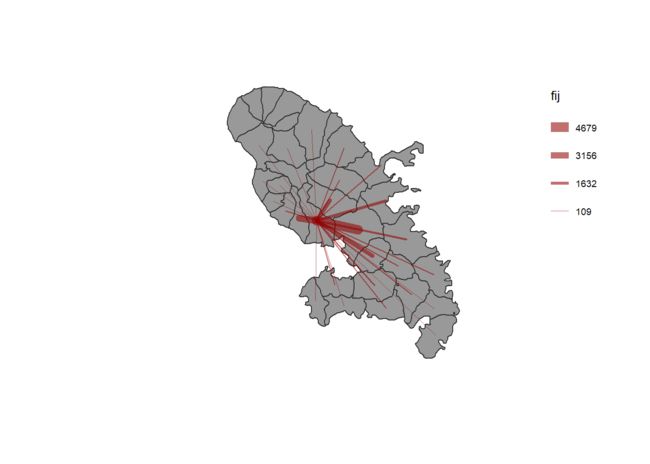
| Flowsi流向图 | gradLinkLayer(x = mob.sf, df = mob, var = "fij",breaks = c(109,500,1000,2000,4679)) propLinkLayer(x = mtq_link, df = mtq_df,var = "fij") |
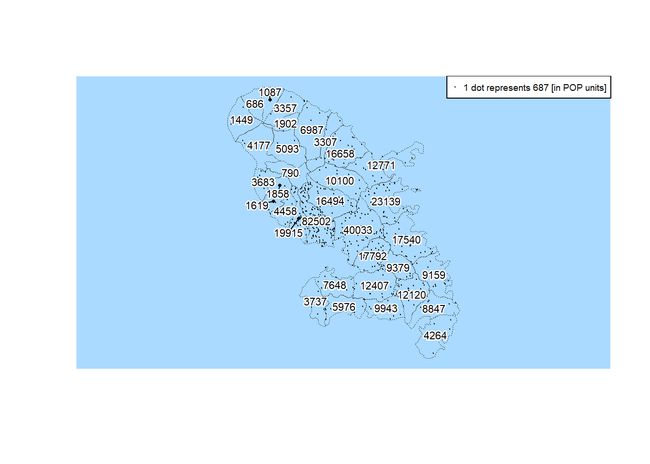
| Dot Density点密度图 | dotDensityLayer(x = mtq, var = "myvar") |
| Labels标签 | labelLayer(x = mtq, txt = "myvar", halo = TRUE, overlap = FALSE) |
library(cartography)
library(sf)

# path to the geopackage file embedded in cartography
path_to_gpkg <- system.file("gpkg/mtq.gpkg", package="cartography")
# import to an sf object
mtq <- st_read(dsn = path_to_gpkg, quiet = TRUE)

# Choropleth
# plot(st_geometry(mtq), col = NA, border = NA, bg = "#aadaff")
choroLayer(x = mtq, var = "POP", method = "quantile", nclass = 8)
# Typology
# plot(st_geometry(mtq), col = NA, border = NA, bg = "#aadaff")
typoLayer(x = mtq, var = "LIBGEO")
# Proportional Symbols
plot(st_geometry(mtq), col = NA, border = NA, bg = "#aadaff")
propSymbolsLayer(x = mtq, var = "POP", inches = 0.1, symbols = "circle")
plot(st_geometry(mtq), lwd = 0.5, border = "grey20", add = TRUE, lty = 3)
# Colorized Proportional Symbols (relative data) 两个连续变量
plot(st_geometry(mtq), col = NA, border = NA, bg = "#aadaff")
propSymbolsChoroLayer(x = mtq, var = "POP", var2 = "MED")
plot(st_geometry(mtq), lwd = 0.5, border = "grey20", add = TRUE, lty = 3)
# Colorized Proportional Symbols (qualitative data) 一个连续一个分类变量
plot(st_geometry(mtq), col = NA, border = NA, bg = "#aadaff")
propSymbolsTypoLayer(x = mtq, var = "POP", var2 = "STATUS")
plot(st_geometry(mtq), lwd = 0.5, border = "grey20", add = TRUE, lty = 3)
# Double Proportional Symbols
plot(st_geometry(mtq), col = NA, border = NA, bg = "#aadaff")
propTrianglesLayer(x = mtq, var1 = "POP", var2 = "MED")
plot(st_geometry(mtq), lwd = 0.5, border = "grey20", add = TRUE, lty = 3)
# OpenStreetMap Basemap (see rosm package)
tiles <- getTiles(x = mtq, type = "osm")
tilesLayer(tiles)
# Isopleth (see SpatialPosition package)
library(SpatialPosition)
smoothLayer(x = mtq, var = "POP", typefct = "exponential", span = 4000, beta = 2, mask = mtq)
typefct参数:空间交互作用函数(spatial interaction function),有两个选项"pareto" (means power law帕累托幂律分布) or "exponential". 如果是"pareto"分布,交互作用函数为: (1 + alpha * mDistance) ^ (-beta)。如果是 "exponential"分布, 交互作用函数为 : exp(- alpha * mDistance ^ beta) 。alpha参数由用户给出的span和beta参数计算出。
span参数: 空间相互作用函数的概率密度为0.5的距离
beta参数: 空间相互作用函数的阻尼因子
如果有var2,那么将计算var1(分子)和var2(分母)的比率。
对于中国地图,建议取span=200000,beta=2
# Discontinuities
# Get a SpatialLinesDataFrame of countries borders 获取边界线数据框
mtq.contig <- getBorders(mtq)
# plot municipalities  画区划图
plot(st_geometry(mtq))
# Plot the population with custom breaks  画面量图
choroLayer(x = mtq, var = "POP", legend.pos = "topright")
# Plot discontinuities画
discLayer(x = mtq.contig, df = mtq, var = "POP",  method = "geom",  nclass = 3, threshold = 0.4)
# Flows包含三种:
# gradLinkLayer():  Graduated Links Layer 绘制一个分级链接层。链接是根据离散的宽度类别绘制的。
# gradLinkTypoLayer():  Graduated and Colored Links Layer绘制一个彩色和渐变链接层。链接是根据离散类别的宽度绘制的。颜色依赖于离散变量的类别。
# propLinkLayer(): Proportional Links Layer绘制一个比例链接层。链接宽度与变量的值成正比。

mtq <- st_read(system.file("gpkg/mtq.gpkg", package="cartography"))
mob <- read.csv(system.file("csv/mob.csv", package="cartography"))
# Create a link layer - work mobilities to Fort-de-France (97209)
mob.sf <- getLinkLayer(x = mtq, df = mob[mob$j==97209,], dfid = c("i", "j"))
# Plot the links - Work mobility
plot(st_geometry(mtq), col = "grey60",border = "grey20")
propLinkLayer(x = mob.sf, df = mob, maxlwd = 10, legend.pos = "topright", var = "fij",
              col = "#92000090", add = TRUE)
# Dot Density
plot(st_geometry(mtq), col = NA, border = NA, bg = "#aadaff")
dotDensityLayer(x = mtq, var = "POP")
plot(st_geometry(mtq), lwd = 0.5, border = "grey20", add = TRUE, lty = 3)

# Label
labelLayer(x = mtq, txt = "POP",halo = TRUE, overlap = FALSE)
Transformations系列
这组函数用于创建或转换空间对象,例如边界提取、网格或链接创建(borders extraction, grid or links creation)。
提供这些功能是为了方便创建一些通常需要地理处理的更高级的地图。
| 类型 | 用法 | 说明 |
|---|---|---|
| Polygons to Grid | mtq_grid <- getGridLayer(x = mtq, cellsize = 3.6e+07, type = "hexagonal", var = "myvar") |
Grids layers can be used by choroLayer() or propSymbolsLayer(). |
| Points to Links | mtq_link <- getLinkLayer(x = mtq, df = link) | Links layers can be used by *LinkLayer(). |
| Polygons to Borders | mtq_border <- getBorders(x = mtq) | Borders layers can be used by discLayer() function |
| Polygons to Pencil Lines | mtq_pen <- getPencilLayer(x = mtq) |
Map Layout系列
- 配合其它cartography函数使用,用于布局设计(layout design),例如,自定义比例尺,指北箭头,标题,来源或作者信息等( customizable scale bar, north arrow, title, sources or author information…)。
| 名称 | 含义 | 函数 |
|---|---|---|
| North Arrow | 指北箭头 | north(pos = "topright") |
| Scale Bar | 比例尺 | barscale(size = 5) |
| Full Layout | 完整布局 | layoutLayer(title = "Martinique", subtitle = TRUE, frame = TRUE, author = "Author", sources = "Sources", north = TRUE, scale = 5) |
| Figure Dimensions | 图的尺寸:基于空间对象的尺寸比例(dimension ratio)、 图边距(figure margins)和输出分辨率(output resolution) 获取图像外形尺寸(figure dimensions)。 |
f_dim <- getFigDim(x = sf_obj, width = 500,mar = c(0,0,0,0)) png("fig.png", width = 500, height = f_dim[2]) par(mar = c(0,0,0,0)) plot(sf_obj, col = "#729fcf") dev.off() |
Color Palettes系列
cartography包封装16种原色调色板。这些调色板可以定制和组合。
carto.pal(pal1 = "blue.pal", n1 = 5, pal2 = "sand.pal", n2 = 3)
调色板方案参见cheatsheet。
| 1 | 2 | 3 | 4 |
|---|---|---|---|
| blue.pal | orange.pal | red.pal | brown.pal |
| green.pal | pink.pal | purple.pal | wine.pal |
| grey.pal | sand.pal | kaki.pal | pastel.pal |
| turquoise.pal | taupe.pal | harmo.pal | multi.pal |
Legends系列
默认图例伴随制图层显示。
更多的参数可以通过legend*()函数定义。
| 函数 | 含义 |
|---|---|
| legendBarsSymbols | Legend for Proportional Bars Maps |
| legendChoro | Legend for Choropleth Maps |
| legendCirclesSymbols | Legend for Proportional Circles Maps |
| legendGradLines | Legend for Graduated Size Lines Maps |
| legendPropLines | Legend for Proportional Lines Maps |
| legendPropTriangles | Legend for Double Proportional Triangles Maps |
| legendSquaresSymbols | Legend for Proportional Squares Maps |
| legendTypo | Legend for Typology Maps |
Classification系列
数据分类、地图分级(Classification)通常用于Choropleth Map(面量图)的制作中,是专题制图中最初,也是最基本的一个步骤。
getBreaks() 用于连续变量进行分类,允许访问大多数用于数据绑定的分类方法。
语法:getBreaks(v, nclass = NULL, method = "quantile", k = 1, middle = FALSE)
-
可用的method包括: quantile, equal, q6, fisher-jenks, mean-sd, sd, geometric progression...
- "sd", "equal", "quantile" and "fisher-jenks" are classIntervals methods.
- Jenks and Fisher-Jenks algorithms are based on the same principle and give quite similar results but Fisher-Jenks is much faster.
- The "q6" method uses the following quantile probabilities: 0, 0.05, 0.275, 0.5, 0.725, 0.95, 1.基于特定的分位数概率。
- The "geom" method is based on a geometric progression along the variable values. 基于几何级数(等比级数)
- The "arith" method is based on an arithmetic progression along the variable values. 基于算术级数(等差级数)
- The "em" method is based on nested averages computation. 基于嵌套的平均值计算
- The "msd" method is based on the mean and the standard deviation of a numeric vector. 基于数值向量的均值和标准差
- The nclass parameter is not relevant, use k and middle instead.
- k indicates the extent of each class in share of standard deviation. 每个类别在标准差中所占份额的程度
- If middle=TRUE then the mean value is the center of a class else the mean is a break value.
- "sd", "equal", "quantile" and "fisher-jenks" are classIntervals methods.
分类方法的详细的中文说明参见数据分类那些事儿
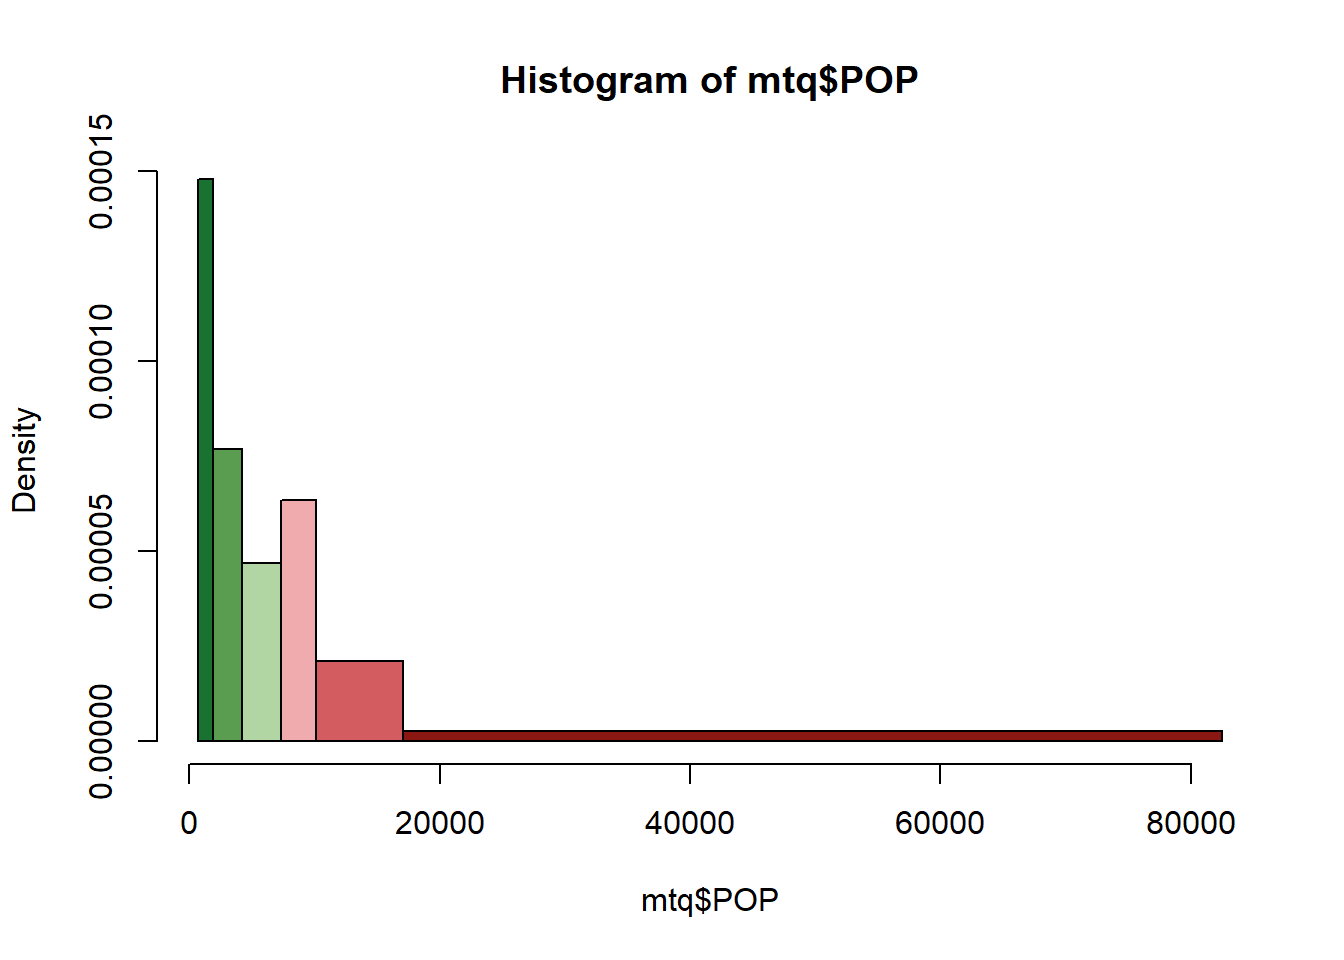
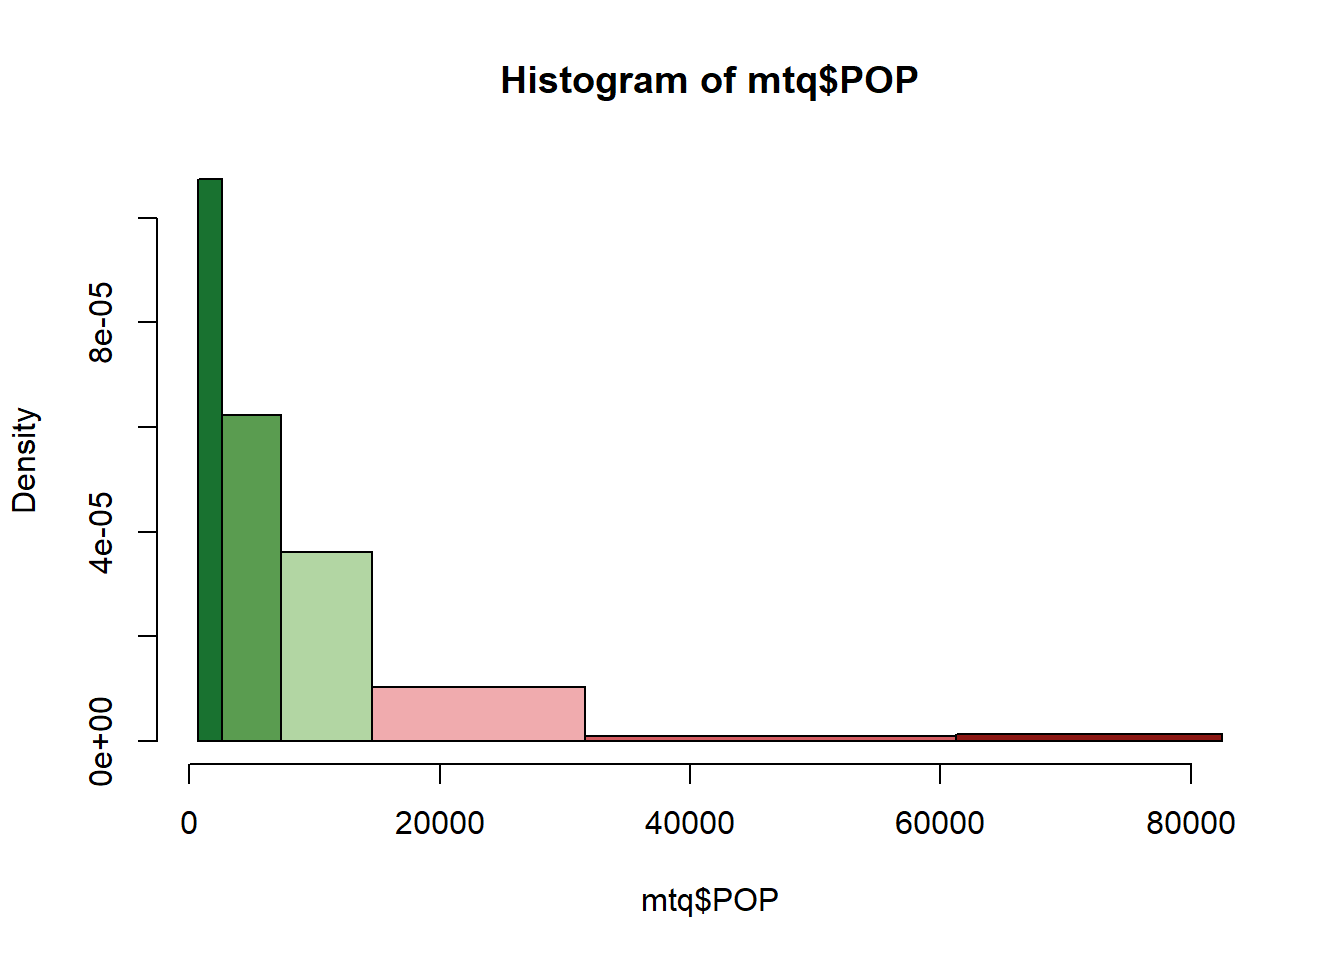
bks1 <- getBreaks(v = mtq$POP, nclass = 6, method = "quantile")
bks2 <- getBreaks(v = mtq$POP, nclass = 6, method = "fisher-jenks")
pal <- carto.pal("green.pal",3, "wine.pal", 3)
hist(mtq$POP, breaks = bks1, col = pal)
hist(mtq$POP, breaks = bks2, col = pal)
setwd("d:/province")
chinamap <- st_read("province.shp")
#点密度图
plot(st_geometry(chinamap))
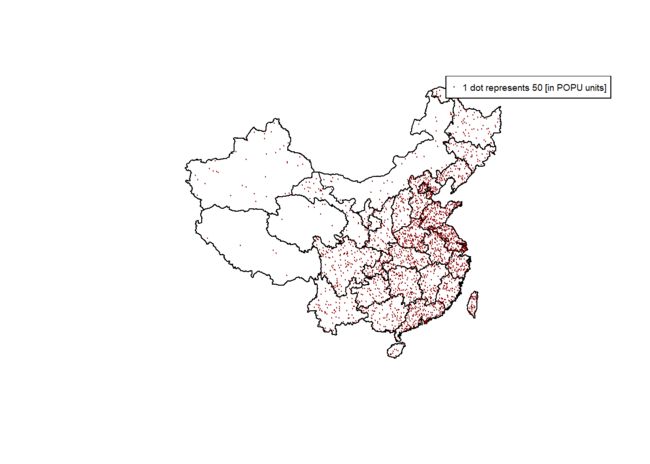
dotDensityLayer(x=chinamap, var="POPU",pch=20, col="red4", n=50)
#平滑数据图
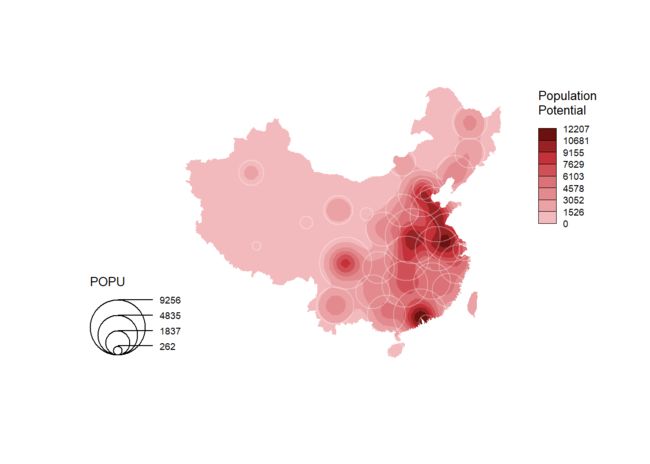
smoothLayer(x = chinamap, var = 'POPU',
             span = 200000, beta = 2,
             mask = chinamap, border = NA,
             col = carto.pal(pal1 = 'wine.pal', n1 = 8),
             legend.title.txt = "Population\nPotential",
             legend.pos = "topright", legend.values.rnd = 0)
propSymbolsLayer(x = chinamap, var = "POPU",   col = NA, border = "#ffffff50")
library(ggplot2)
library(cartography)
library(tidyverse)

older <- read.csv("c:/users/wintryheart/desktop/oldermarriage.csv")
chinamap <- read_sf("d:/province/province.shp")
chinamap2 <- left_join(chinamap, older, by=c("NAME"="province"))
chinamap2 <- select(chinamap2, "NAME","unmar","married","divorce","widow")

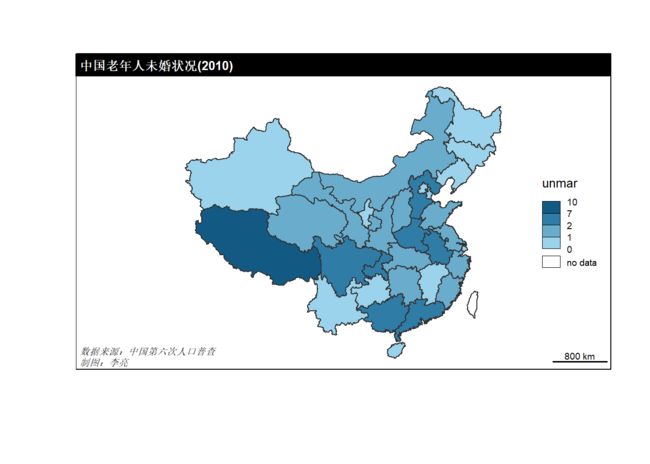
choroLayer(x=chinamap2,var="unmar", method = "fisher-jenks", nclass = 4, legend.pos = "right")
layoutLayer(title="中国老年人未婚状况(2010)",sources = "数据来源:中国第六次人口普查", author = "制图:李亮")

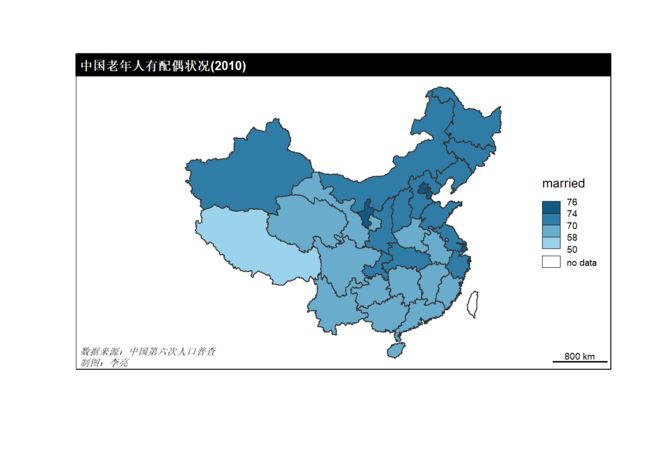
choroLayer(x=chinamap2,var="married", method = "fisher-jenks", nclass = 4, legend.pos = "right")
layoutLayer(title="中国老年人有配偶状况(2010)",sources = "数据来源:中国第六次人口普查", author = "制图:李亮")


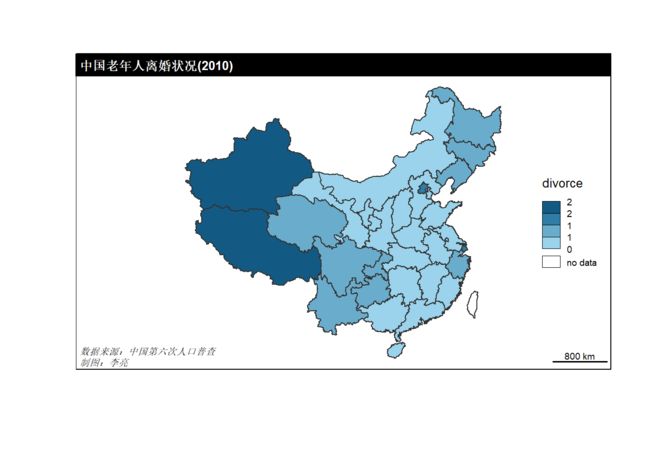
choroLayer(x=chinamap2,var="divorce", method = "fisher-jenks",nclass=4, legend.pos = "right")
layoutLayer(title="中国老年人离婚状况(2010)",sources = "数据来源:中国第六次人口普查", author = "制图:李亮")

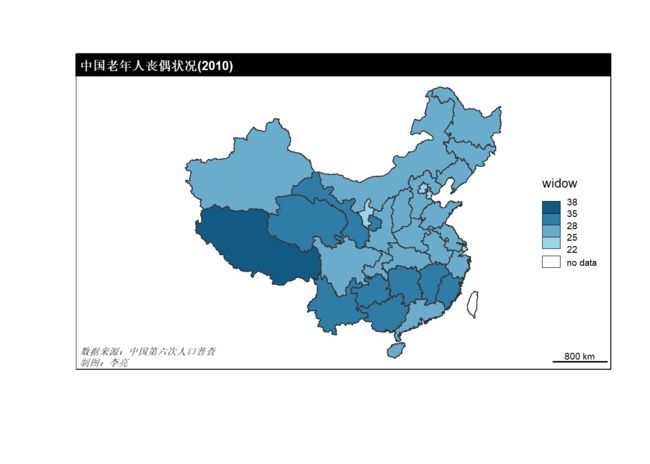
choroLayer(x=chinamap2,var="widow", method = "fisher-jenks",nclass=4, legend.pos = "right")
layoutLayer(title="中国老年人丧偶状况(2010)",sources = "数据来源:中国第六次人口普查", author = "制图:李亮")
