四、构建预测模型2:主成分分析
(一)判断主成分个数
【结论】:根据结果,选择主成分个数为2个
library(psych)
hr_pc <- select(hr,-left,-sales,-salary)
fa.parallel(hr_pc, fa="pc", n.iter=100, show.legend=FALSE, main="Scree plot with parallel analysis")
## Parallel analysis suggests that the number of factors = NA and the number of components = 2
(二)提取主成分
【结论】:
1.选择后的主成分RC1解释了数据33%的方差,RC2解释了16%;2个主成分共解释了数据49%的方差;
2.RC1与"satisfaction,years"正相关,与"project, hours"负相关,称为综合因子1
3.RC2与"accident, promoion"正相关,与"evaluation"负相关,可称为综合因子2
hr.good.rc <- principal(hr_good_pc, nfactors=2, scores=T)
hr.good.rc
Principal Components Analysis
Call: principal(r = hr_good_pc, nfactors = 2, scores = T)
Standardized loadings (pattern matrix) based upon correlation matrix
RC1 RC2 h2 u2 com
satisfaction 0.84 -0.19 0.74 0.26 1.1
evaluation 0.25 -0.66 0.49 0.51 1.3
project -0.85 0.03 0.73 0.27 1.0
hours -0.64 -0.30 0.50 0.50 1.4
years 0.61 0.10 0.39 0.61 1.1
accident 0.14 0.55 0.32 0.68 1.1
promotion 0.08 0.50 0.26 0.74 1.1
RC1 RC2
SS loadings 2.30 1.12
Proportion Var 0.33 0.16
Cumulative Var 0.33 0.49
Proportion Explained 0.67 0.33
Cumulative Proportion 0.67 1.00
Mean item complexity = 1.2
Test of the hypothesis that 2 components are sufficient.
The root mean square of the residuals (RMSR) is 0.14
with the empirical chi square 2283.14 with prob < 0
Fit based upon off diagonal values = 0.66
(三)获取主成分得分
【结论】:优秀员工离职人员在如下两个范围出现
1.范围1:RC1[-2,-1], RC2[-1,1]
2.范围2:RC1[0,1], RC2[-1.5,0]
hr.good.rc.scores <- as.data.frame(hr.good.rc$scores)
hr.good.rc.scores$left <- hr_good$left
ggplot(hr.good.rc.scores, aes(RC1,RC2,color=factor(left))) + geom_point()
五、构建预测模型3:聚类
library(cluster)
library(fpc)
(一)选择合适的数据,并进行标准化
hr_good_cl <- select(hr_good,-left,-sales,-salary)
hr_good_cl_scale <- as.data.frame(scale(hr_good_cl))
(二)选择合适的聚类数量
【结论】:根据图形与pamk的值,选择聚类个数为6
source("wssplot.r")
wssplot(hr_good_cl_scale)
set.seed(0004)
pamk.best <- pamk(hr_good_cl_scale)
pamk.best$nc
# [1] 6
(三) 拟合聚类,并查看分类结构
fit.pam <- pam(hr_good_cl_scale, k=6)
cl.pam <- table(hr_good$left, fit.pam$clustering)
cl.pam
1 2 3 4 5 6
stay 228 72 150 138 364 33
left 326 83 8 502 87 21 4
hr_good$clustering <- fit.pam$clustering
ggplot(hr_good, aes(clustering, fill=factor(left))) + geom_bar(position="dodge") + scale_x_discrete(limits=c(1,2,3,4,5,6)) + theme3 + labs(title="类别2和类别3中,离职人员比例远高于其他分类")
clusplot(fit.pam, main="基于PAM算法得到的六组聚类图")
(四) 评价聚类:兰德指数
【结论】:聚类结果与实际离职与否的结果吻合度不是很高;
从之前的数据分析来看,优秀员工的离职与否在两种不同情境下都有较高的比例;
library(flexclust)
randIndex(cl.pam)
ARI
0.1742728
(五)根据聚类的分类进行子集细分,并描述统计情况
## 1. 查看各个聚类的统计量
【结论】:从统计量(均值)上看,如下两个情况的员工离职意向很高
1.离职比例最高的类别2(left=0.92),satisfaciton非常低(0.11),项目数量最高(6.17),月均工作时间最长(274.6)
2.离职比例次高的类别3(left=0.77),评价极高(0.96),满意度(0.78)、月均工作时间(238.9),工作年限(5.0)
hr_good <- as.data.frame(hr_good)
hr_good$left <- as.integer(hr_good$left)
hr_good$left <- ifelse(hr_good$left==1,0,1)
select(hr_good,-sales,-salary) %>% group_by(., clustering) %>% summarize_all(.,mean)
# A tibble: 6 × 9
clustering satisfaction evaluation project hours years accident left promotion
1 1 0.7574729 0.8453791 4.673285 246.5036 5.223827 0.0000000 0.588447 0
2 2 0.1114945 0.8714176 6.167033 274.6451 4.137363 0.0000000 0.920879 0
3 3 0.7809969 0.9649080 4.605828 238.9632 5.170245 0.0000000 0.769938 0
4 4 0.5258667 0.8865778 4.960000 219.9511 5.142222 1.0000000 0.386667 0
5 5 0.5542078 0.8585714 4.446753 161.2779 5.088312 0.0000000 0.054545 0
6 6 0.5908108 0.8648649 4.864865 225.5135 5.567568 0.1891892 0.108108 1
## 2. 选择类别2和类别3的子集
hr_good_cl_select <- filter(hr_good, clustering %in% c(2,3))
summary(hr_good_cl_select)
satisfaction evaluation project hours years accident
Min. :0.090 Min. :0.7600 Min. :4.000 Min. :137.0 Min. : 4.000 Min. :0
1st Qu.:0.100 1st Qu.:0.8525 1st Qu.:5.000 1st Qu.:243.0 1st Qu.: 4.000 1st Qu.:0
Median :0.110 Median :0.9200 Median :6.000 Median :260.0 Median : 4.000 Median :0
Mean :0.391 Mean :0.9104 Mean :5.515 Mean :259.8 Mean : 4.569 Mean :0
3rd Qu.:0.790 3rd Qu.:0.9700 3rd Qu.:6.000 3rd Qu.:282.0 3rd Qu.: 5.000 3rd Qu.:0
Max. :1.000 Max. :1.0000 Max. :7.000 Max. :310.0 Max. :10.000 Max. :0
left promotion sales salary clustering
Min. :0.000 Min. :0 sales :408 low :895 Min. :2.000
1st Qu.:1.000 1st Qu.:0 technical :341 medium:628 1st Qu.:2.000
Median :1.000 Median :0 support :213 high : 39 Median :2.000
Mean :0.858 Mean :0 IT :129 Mean :2.417
3rd Qu.:1.000 3rd Qu.:0 product_mng:104 3rd Qu.:3.000
Max. :1.000 Max. :0 accounting : 94 Max. :3.000
(Other) :273
## 3. 逐一分析子集的变量分布
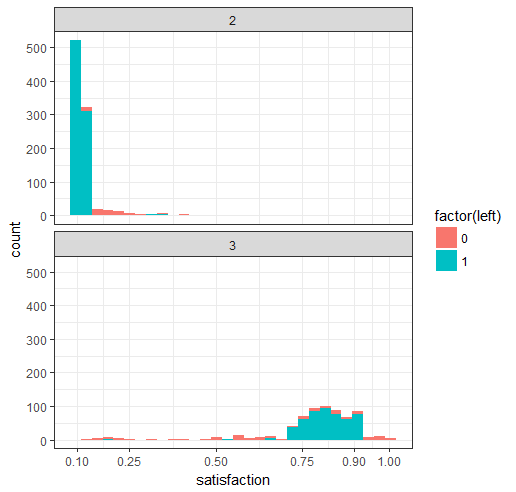
## 3.1 满意度分布
hr_good_cl_select$clustering <- factor(hr_good_cl_select$clustering)
ggplot(hr_good_cl_select , aes(satisfaction,fill=factor(left))) + geom_histogram() + facet_wrap(~clustering,ncol=1) + theme2 + scale_x_continuous(limits=c(0.1,0.25,0.50,0.75,0.9,1.0))
## 3.2 评价分布
ggplot(hr_good_cl_select , aes(evaluation,fill=factor(left))) + geom_histogram() + facet_wrap(~clustering,ncol=1) + theme2 + scale_x_continuous(breaks=c(0.77,0.79,0.8,0.84,0.85,0.88,0.89,0.91,0.93,0.94,0.98,1.0)) + theme(axis.text.x=element_text(angle=90),panel.grid.minor=element_blank())
## 3.3 项目数量分布
ggplot(hr_good_cl_select , aes(project,fill=factor(left))) + geom_bar() + facet_wrap(~clustering,ncol=1) + theme2
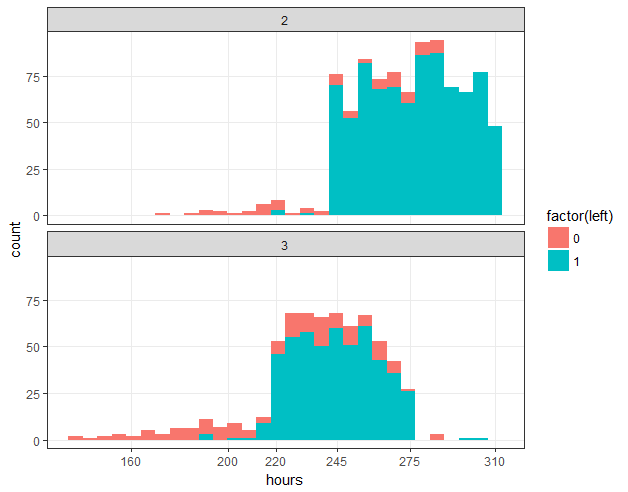
## 3.4 月均工作时长分布
ggplot(hr_good_cl_select , aes(hours,fill=factor(left))) + geom_histogram() + facet_wrap(~clustering,ncol=1) + theme2 + scale_x_continuous(breaks=c(160,200,220,245,275,310)) + theme(panel.grid.minor=element_blank())
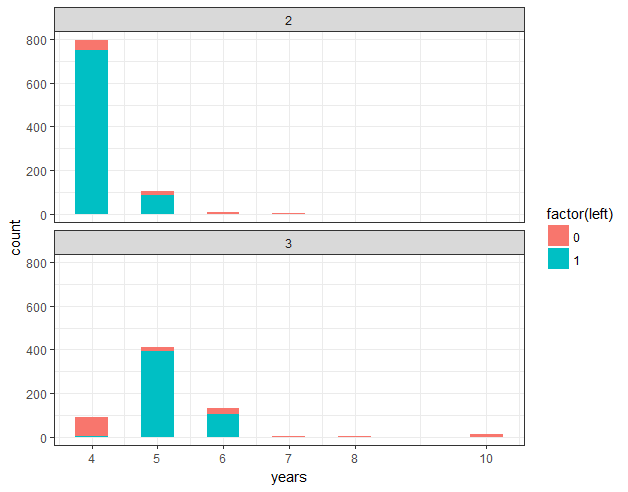
## 3.5 工作年限分布
ggplot(hr_good_cl_select , aes(years,fill=factor(left))) + geom_histogram(binwidth=0.5) + facet_wrap(~clustering,ncol=1) + theme2 + scale_x_continuous(breaks=c(4,5,6,7,8,10))
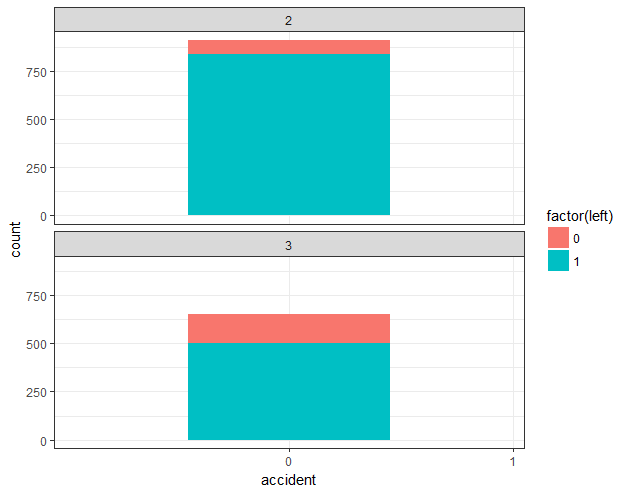
## 3.6 工作事故分布
ggplot(hr_good_cl_select , aes(accident,fill=factor(left))) + geom_bar(width=0.3) + facet_wrap(~clustering,ncol=1) + theme2
## 3.7 晋升情况分布
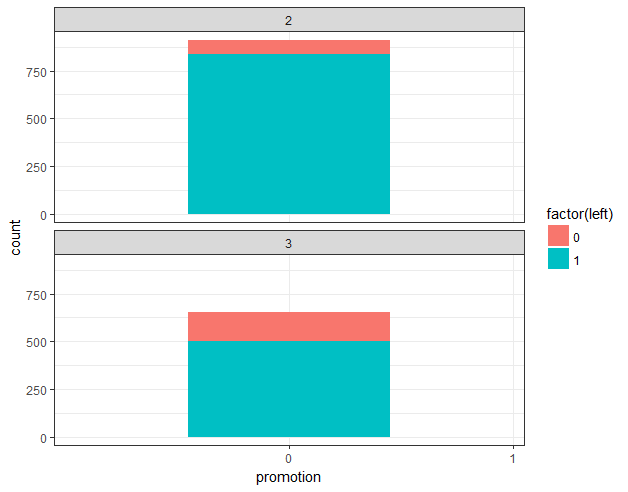
ggplot(hr_good_cl_select , aes(promotion,fill=factor(left))) + geom_bar() + facet_wrap(~clustering,ncol=1) + theme2 + scale_x_discrete(limits=c(0,1))
## 3.7 部门分布
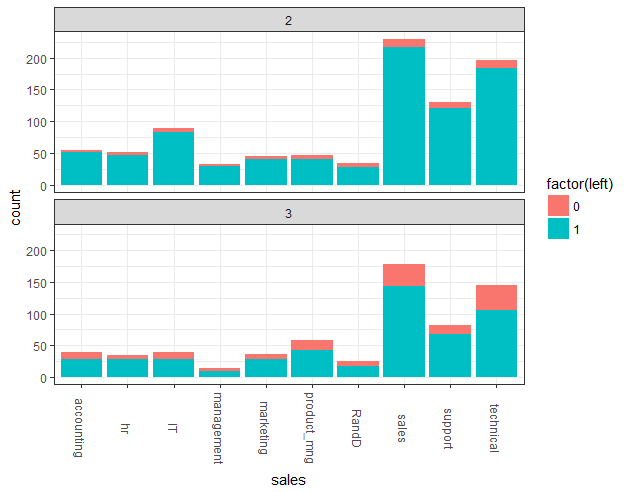
ggplot(hr_good_cl_select , aes(sales,fill=factor(left))) + geom_bar() + facet_wrap(~clustering,ncol=1) + theme2 + theme(axis.text.x=element_text(angle=270,vjust=0.5))
## 3.7 薪资水平分布
ggplot(hr_good_cl_select , aes(salary,fill=factor(left))) + geom_bar(width=0.5) + facet_wrap(~clustering,ncol=1) + theme2 + scale_y_continuous(breaks=c(0,20,100,200,300,400,500)) + theme(panel.grid.minor=element_blank())


