原文地址 https://www.kaggle.com/rajwardhanshinde/data-analysis-and-predicting-percentage/notebook
数据集包括8个变量
- gender 性别
- race/ethnicity 种族
- parental level of education 父母教育水平
- lunch 午餐
- test preparation course (不太明白这个指标)
- math score 数学
- reading score 阅读
- writting score 写作
第一步:简单查看数据
import pandas as pd
import numpy as np
sp = pd.read_csv("StudentsPerformance.csv") #读入数据
sp.head() #查看数据前5行
sp.isnull().sum() #查看数据是否包括缺失值
sp.gender.value_counts() #value_counts()函数显示唯一值及其出现次数
sp['Percentage'] = sp['math score'] + sp['reading score'] + sp['writing score']
sp['Percentage'] = sp['Percentage'] / 3 #数据框增加一列平均成绩
sp.sample(10) #随机选取10行查看
sorted_df = sp.sort_values(by='Percentage',ascending=False)#排序
原文还增加了一列Result,意为三门课程成绩任意一门低于35分即为‘挂科’,否则为通过;自己暂时还不知道该如何实现增加这一列。原文也提到了尝试时他也遇到了错误。如果以一个指标作为依据实现起来就比较简单;比如是平均成绩小于35即为挂科的话,可以用如下语句实现
import numpy as np
np.where(sp['Percentage'] < 35, 'F' , "P" )
和R语言里的ifelse()语句有些像
根据平均成绩来划分ABCDEF
def Grading(x):
    if x >= 80:
        return 'A'
    if x >= 70:
        return 'B'
    if x >= 60:
        return 'C'
    if x >= 50:
        return 'D'
    if x >= 35:
        return 'E'
    else:
        return 'F'

sp['Grade'] = sp.apply(lambda x : Grading(x['Percentage']), axis=1) #这条语句没有看明白
sp.head(10)
第二步:简单的数据可视化
-
父母的教育水平是否会影响孩子的成绩
import matplotlib.pyplot as plt
import seaborn as sns
plt.figure(figsize=(20,10))
sns.set(style='whitegrid', palette='coolwarm', font_scale=1.2)
sns.barplot(data=sp, x='parental level of education', y='Percentage')
plt.ylim([0,100])
plt.savefig('1.png')
这类数据通过箱线图展示可能会更为直观
plt.figure(figsize=(20,10))
sns.boxplot(data=sp, x='parental level of education', y='Percentage')
plt.ylim([0,100])
plt.savefig('2.png')
-
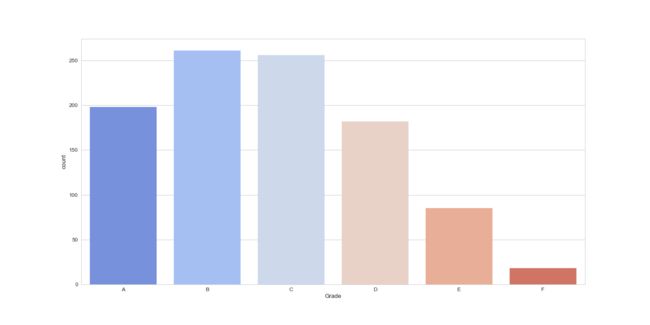
取得不同成绩的学生人数
plt.figure(figsize=(20,10))
sns.countplot(data=sp, x='Grade', order=['A','B','C','D','E','F'])
plt.savefig('3.png')
-
簇状柱形图展示不同父母教育水平取得不同成绩的人数(这句话怎么这么别扭呢?)
plt.figure(figsize=(20,10))
sns.countplot(data=sp, x='parental level of education', hue='Grade')
plt.savefig('4.png')
-
不同的午餐学生成绩
plt.figure(figsize=(20,10))
sns.countplot(data=sp, x='lunch', hue='Grade')
plt.savefig('5.png')
今天就先到这里吧!
欢迎大家关注我的公众号 小明的数据分析笔记本


