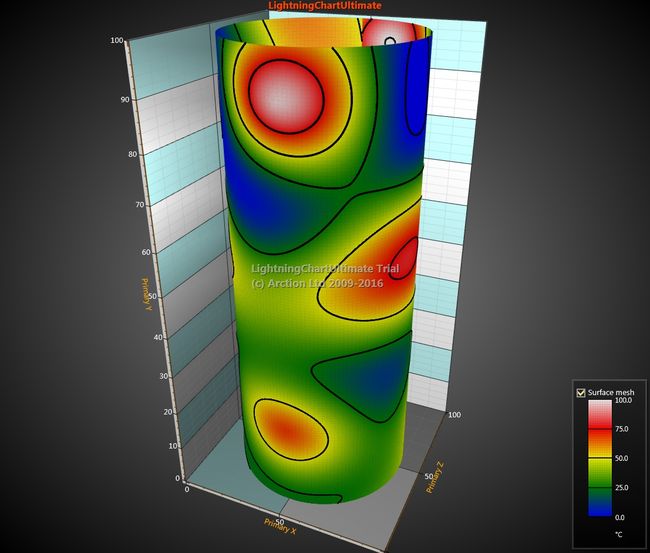
本文主要是基于数值着色与等高线特征,用数值绘制3D等高线网格图。以下是如何利用LightningChart绘制几何管道图并显示数据,以及提供相应的源代码。
以下是绘制此图的源代码
LightningChartUltimate _chart = new LightningChartUltimate();
_chart.BeginUpdate();
//Create Surface mesh
_mesh = new SurfaceMeshSeries3D(v, Axis3DBinding.Primary, Axis3DBinding.Primary, Axis3DBinding.Primary);
//CONTOURS
_mesh.ContourLineType = ContourLineType3D.ColorLineByValue;
_mesh.ContourLineWidth = 1.5;
//WIREFRAME
_mesh.WireframeType = SurfaceWireframeType.Wireframe;
_mesh.WireframeLineStyle.Width = 3;
_mesh.WireframeLineStyle.Color = Color.FromArgb(20, Color.Black);
_mesh.WireframeOffset.SetValues(0, 0, 0);
//FILL
_mesh.ColorSaturation = 80;
_mesh.Fill = SurfaceFillStyle.PalettedByValue;
//Discontinuity is caused by surface mesh...end meeting each other, and data is not fluently continous over that.
InitializePalette();
double[,] x = null;
double[,] y = null;
double[,] z = null;
double[,] values = null;
CreateGeometryPipe(out x, out y, out z);
CreateValuesWaterDrops(out values);
UpdateMesh(x, y, z, values);
v.SurfaceMeshSeries3D.Add(_mesh);
v.YAxisPrimary3D.Units.Text = "°C";
_chart.EndUpdate();
总结
等高线地形图可综合应用于判断通视情况,水系水文特征,气候特征,地形状况与区位的选择(点、线、面 )。此3D几何图是用来判断气候特征的,非常直观。
