快要开始写毕业论文了,算法性能测试不可避免,今天要写的这些东西大部分是在年前弄完的,趁热记录一下。
网上是有各种测试VOT的代码的,我找到的大部分是matlab的,比如这个:VOC_TOOL_KIT,不过我一直在做的这个算法是用CPP写的,所以还是想写一个CPP的性能测试框架,结合cpp11的一些调试器,这个东西其实是不难的,下面分享一下。
根据VOT数据的格式,大概是这么一个流程:
1. 根据list自动读取视频
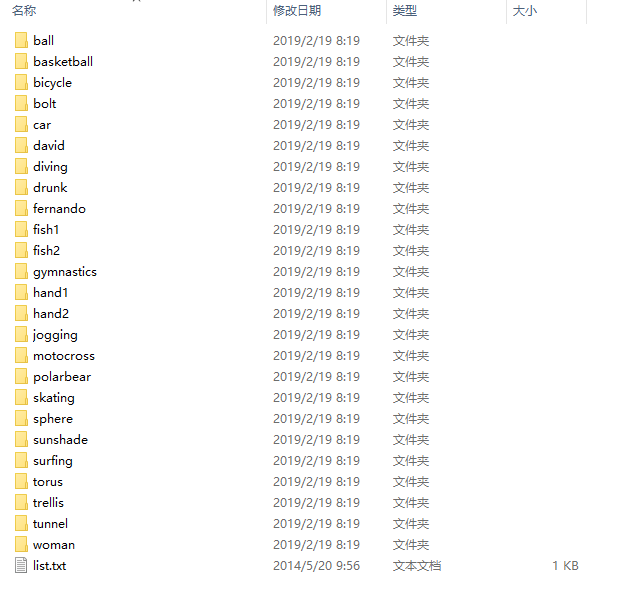
VOT数据的格式长这样:
每个文件夹里包含图片序列,list里面写的是每个文件夹的名称,是为了读取文件夹下的图片和groundtruth信息用的。
把每一行的信息存储为一个字符串,这样会得到一个字符串列表,我们用vector来存储:
// 读取list列表的信息,输入参数为`list`的路径。
vector read_list(const string &list_name)
{
    vector list_mes;
    ifstream list(list_name);      //ifstream对象。
    string line;
    while(getline(list,line))   //读取list列表信息
    {
        //cout<
2. 读取groundtruth和图片序列
首先来讲groundtruth的读取,groundtruth是标注的跟踪框信息,每一行有8个数字(竟然还是小数?),分别是:
分别是矩形的四个点的坐标,但是值得注意的是,这四个点并没有对应的位置关系(这个问题应该是标注的时候的问题),所以我们就只能根据坐标之间相互的大小关系来得到矩形框的信息,我们希望最后groundtruth提取到vector里面。
过程和上面的类似,先拿到每一行,然后把每一行分割出来(这种题目在LeetCode里刷的太多了)转换为数字。而后根据他们之间的大小关系来构建cv::Rect对象,这个过程中把小数转换为整数,我用的是四舍五入,这个不是最重要的。
cv::Rect split_line(string &line)
vector read_groundtruth(const string &groundtruth_txt,int &num_of_line)    //const常量才可以由字符串隐式转换
{
    vector groundtruth;            // vector  用来存groundtruth
    ifstream groundtruth_file;               // 文件对象
    groundtruth_file.open(groundtruth_txt);      //打开txt文件
    string line;         //当前行
    Rect rect_tmp;       //每一行搞成一个rect
    while(getline(groundtruth_file,line))
    {
        rect_tmp=split_line(line);    //分解字符串为RECT
        groundtruth.push_back(rect_tmp);    //压入vector
        num_of_line++;
    }
    groundtruth_file.close();
    return groundtruth;
}


cv::Rect split_line(string &line)
{
    double pos[8];            //八个点
    int index=0;              //点的索引
    string tmp;               //暂存的string,来转换为double
    tmp.clear();              //清零
    for(auto l:line)          //遍历字符串,这里面是一个比较简单的字符串根据特定字符分离的一个算法
    {
        if(l==',')
        {
            pos[index]=stod(tmp);
            index++;
            tmp.clear();     //一定要记得清零
        }
        else
        {
            tmp+=l;
        }
    }
    pos[index]=stod(tmp);    //处理最后一个
    //四个点,对应矩形的四个点

    /* 我后来发现标注的点并不是遵循这样的规律,不一定一开始是左上角的点,这取决于当时标注的
    人先从哪个点开始点的,所以应该来使用坐标之间的大小关系来确定到底是哪个点
    cv::Point2f up_left(pos[0],pos[1]);
    cv::Point2f up_right(pos[2],pos[3]);
    cv::Point2f down_right(pos[4],pos[5]);
    cv::Point2f down_left(pos[6],pos[7]);
    //cout<
3. 初始化跟踪器并运行
我这里用的KCF,大概的框架如下:
void kcf_test()
{
   //读取list信息
    vector list=read_list("vot2015//list.txt");
   //主循环,每一个循环代表一个图片序列
    for(int i=0;i groundtruth=read_groundtruth(path+"groundtruth.txt",num_of_line);

        int index=1;
        for(auto gg:groundtruth)
        {

            res_ground< track_res;
        track_res.push_back(groundtruth[0]);

        //读取第一张图片并初始化跟踪器
        string zeros8="00000000";
        cv::Mat img=imread(path+"00000001.jpg");
        imshow("img",img);
        double all_time=0;
        KCFTracker tracker(true,true,true,true);    //构造
        KCFTracker tracker_NI(true,true,true,false);    //构造
        tracker.init(groundtruth[0],img);      //初始化
        tracker_NI.init(groundtruth[0],img);
        cv::rectangle(img,groundtruth[0],cv::Scalar(0,0,255));   //第一帧画框

        for(int j=2;j(getTickCount());
            cv::Rect Rect_kcf_i=tracker.update(frame);
            cv::Rect Rect_kcf=tracker_NI.update(frame);
            double time=((double)getTickCount()-start)/getTickFrequency();

            //主要的参数
            res_kcf << j << "\t" << Rect_kcf.x << "\t" << Rect_kcf.y << "\t" << Rect_kcf.width << "\t" << Rect_kcf.height << "\n";
            res_kcf_inter << j << "\t" << Rect_kcf_i.x << "\t" << Rect_kcf_i.y << "\t" << Rect_kcf_i.width << "\t" << Rect_kcf_i.height << "\n";


            all_time+=time;
            //cout<<"fps\t"<<1./time<
我会把跟踪器的跟踪结果(cv::Rect)保存到txt里面,然后使用matlab或者python写脚本来解析这些txt文件来画图或者干你想干的任何事情。
4.解析TXT文件并画图(以PrecisionPlot为例)
为了练习使用python,后面的画图之类的脚本都是用python写的,可能用的不熟,代码难免有冗余。
我主要画两个图,第一个是CLE(center location erroe),就是中心位置误差,就是跟踪框的中心和标注的跟踪框的位置之间的欧氏距离,横轴用帧数,纵轴用CLE。
第二个也是跟踪里面常用的,PrecisionPlot,横轴是阈值,从0-100,纵轴是一个百分比,这个百分比的含义为:CLE小于等于当前阈值的帧数在所有帧数中所占的比例。
代码在下面,主要的功夫还是花在了解析字符串和批量处理上面,注释写的比较清楚。
# -*- coding: utf-8 -*-
"""
Created on Mon Jan 28 20:16:05 2019

@author: zhxing
this code can draw position precision of tracking result in vot challenge
"""

import math
import matplotlib.pyplot as plt
import numpy

#存放文件的路径以及各种文件的路径
path="results//"
ave_fps_kcf="_ave_fps_kcf.txt"
ave_fps_kcf_inter="_ave_fps_kcf_inter.txt"
res_ground="_res_ground.txt"
res_kcf="_res_kcf.txt"
res_kcf_interpolation="_res_kcf_interpolation.txt"

file=open(path+"list.txt")
lines=file.readlines()

#calculate the Pre,CLE is CENTOR LOCATION ERROR,and it is a list
def calculatePre(CLE):
    res=[]
    for thresh in range(1,100):
        tmp=numpy.array(CLE)  #get the temporary variable
        tmp[tmp<=thresh]=1
        tmp[tmp>thresh]=0
        num=sum(tmp)
        rate=float(num)/float(tmp.size)
        res.append(rate)
    return res


#定义画中心位置误差图像的函数
def drawCLE(title,ResGroundLines,ResKcfLines,ResKcfILines):
    CleKcf=[]
    CleKcfI=[]
    num_of_frame=len(ResGroundLines)-2        #帧数,去掉表头和最后一帧(主要是我结果好像少写了一帧)
    for index in range(1,(num_of_frame+1)):
        #每一行拿出来,第一列是分别是 frame   x   y   width   height,分离出来并转换成数字
        GroundPos=(ResGroundLines[index]).split('\t')
        KcfPos=(ResKcfLines[index]).split('\t')
        KcfIPos=(ResKcfILines[index]).split('\t')
        GroundPos=list(map(int,GroundPos))
        KcfPos=list(map(int,KcfPos))
        KcfIPos=list(map(int,KcfIPos))

        #提取中心位置
        P_G=[GroundPos[1]+GroundPos[3]/2,GroundPos[2]+GroundPos[3]/2]
        P_K=[KcfPos[1]+KcfPos[3]/2,KcfPos[2]+KcfPos[4]/2]
        P_KI=[KcfIPos[1]+KcfIPos[3]/2,KcfIPos[2]+KcfIPos[4]/2]

        CLE_KCF=math.sqrt((P_K[0]-P_G[0])**2+(P_K[1]-P_G[1])**2)
        CLE_KCF_I=math.sqrt((P_KI[0]-P_G[0])**2+(P_KI[1]-P_G[1])**2)

        CleKcf.append(CLE_KCF)
        CleKcfI.append(CLE_KCF_I)

    plt.figure()       #CLE  CENTOR LOCATION ERROR
    plt.title(title+"CLE Plot")
    plt.plot(CleKcf,color='red',label="KCF")
    plt.plot(CleKcfI,color='blue',label="KCF_I")
    plt.legend()
    plt.savefig("results//png//"+title+".png",dpi=600)

    PreKcf=calculatePre(CleKcf)
    PreKcfI=calculatePre(CleKcfI)

    plt.figure()       #PRECISION PERCENT
    plt.title(title+"Precision Plot")
    plt.plot(PreKcf,color='red',label='KCF')
    plt.plot(PreKcfI,color='blue',label="KCF_I")
    plt.legend()
    plt.savefig("results//png//"+title+"_Pre.png",dpi=600)

#主函数
for target in lines:
    print("this is the:\t"+target)
    #target有个回车,这里需要把这个回车给去掉,然后下面把当前target下的文件读取
    AveFpsKcf=open(path+target[:-1]+ave_fps_kcf)
    AveFpsKcfI=open(path+target[:-1]+ave_fps_kcf_inter)
    ResGround=open(path+target[:-1]+res_ground)
    ResKcf=open(path+target[:-1]+res_kcf)
    ResKcfI=open(path+target[:-1]+res_kcf_interpolation)
    AveFpsKcfLines=AveFpsKcf.readlines()
    AveFpsKcfILines=AveFpsKcfI.readlines()
    ResGroundLines=ResGround.readlines()
    ResKcfLines=ResKcf.readlines()
    ResKcfILines=ResKcfI.readlines()
    drawCLE(target,ResGroundLines,ResKcfLines,ResKcfILines)
大概就是这样了。这个代码我不是单独写的,而是写在了darknet里面了,具体在src/image_opencv.cpp里面,可以参考。
github地址:https://github.com/zhxing001/DarkNet

