R语言基础绘图系统
基础图形——直方图、金字塔图
3.直方图
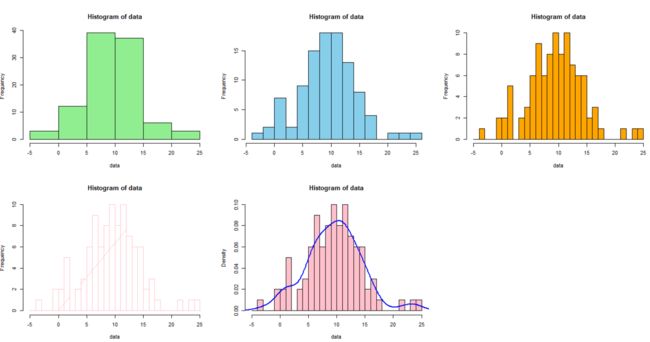
参数设置及比较。
op <- par(mfrow=c(2,3))
data <- rnorm(100,10,5)

hist(data,col = 'light green') #默认分组
hist(data,col = 'sky blue',breaks = 15) #分成15组
hist(data,col = 'orange',breaks = seq(-5,25,1)) #自定义组距
hist(data,col = 'pink',breaks = seq(-5,25,1),density = T)

hist(data,col = 'pink',breaks = seq(-5,25,1),freq = F) #freq绘制概率密度图
lines(density(data),col='blue',lty=1,lwd=2) #添加曲线

par(op)
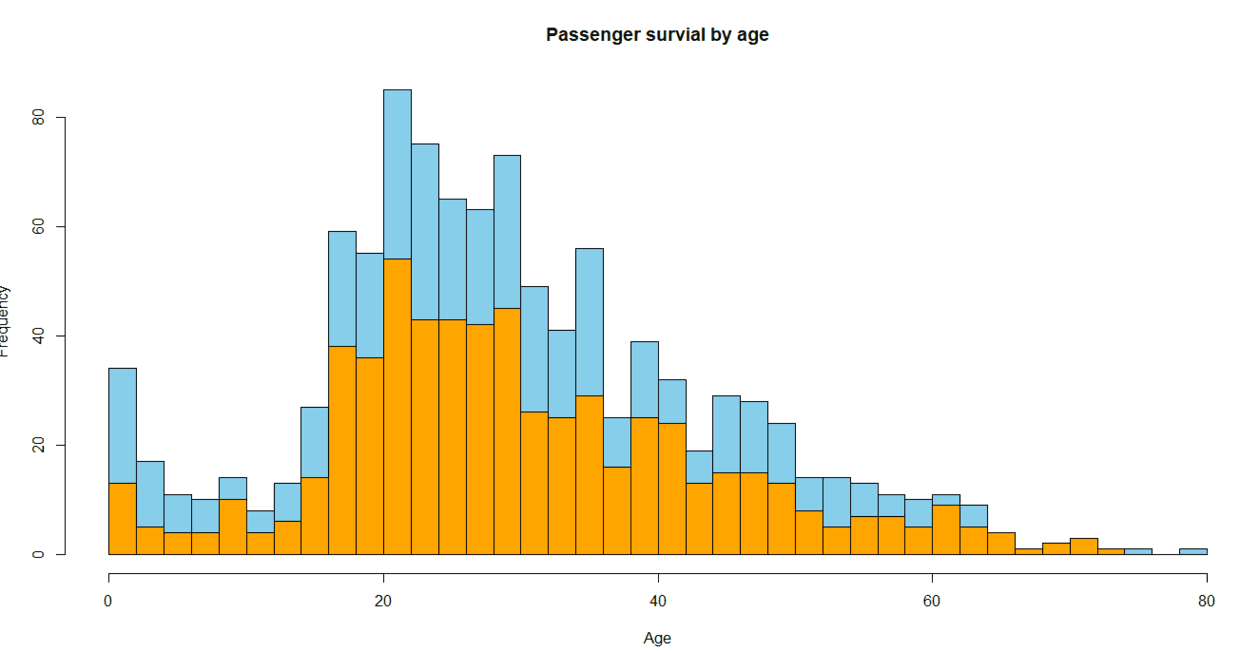
直方图叠加。
#泰坦尼克号不同年龄与生存关系
library(effects)
data("TitanicSurvival")
hist(TitanicSurvival$age,main = 'Passenger survial by age',
     xlab = 'Age',col = 'sky blue',breaks = seq(0,80,2))
hist(TitanicSurvival$age[which(TitanicSurvival$survived=="no")],
     col='orange',breaks=seq(0,80,2),add=TRUE) #add添加死亡直方图
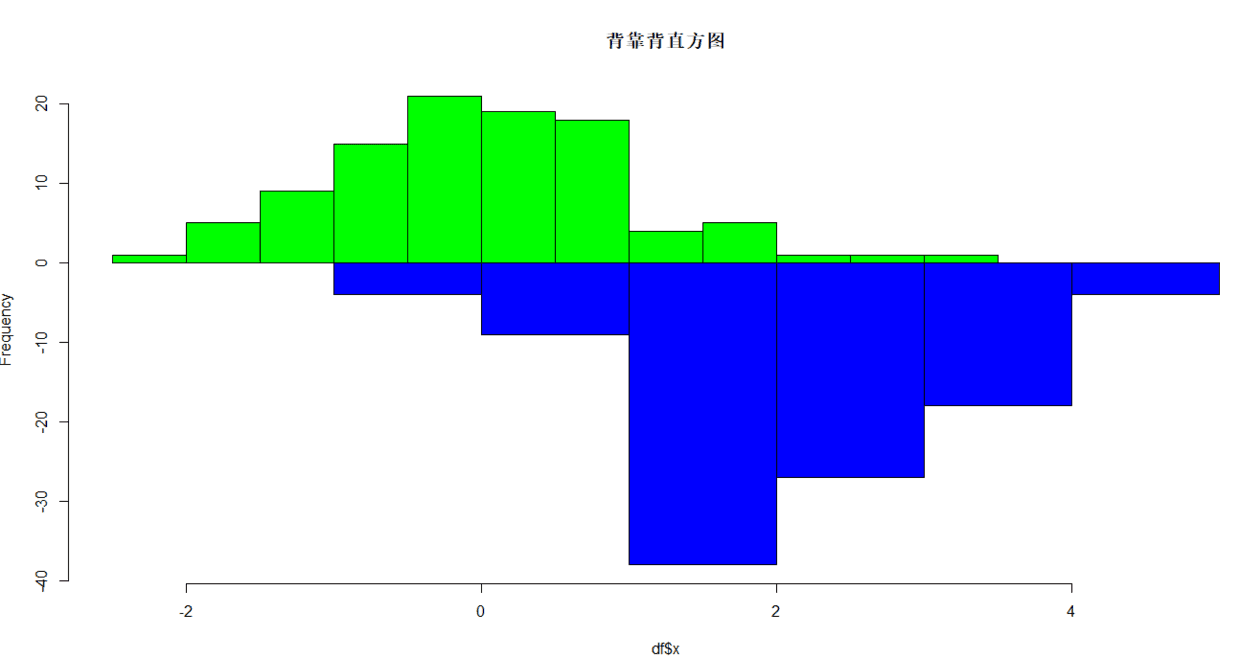
背靠背直方图(back to back histogram)。
df=data.frame(x=rnorm(100),x2=rnorm(100,mean = 2))
#将两个直方图存入对象
h1=hist(df$x,plot = F)
h2=hist(df$x2,plot = F)
#将h2的值反转
h2$counts=-h2$counts
#找到y轴取值范围
hmax=max(h1$counts)
hmin=min(h2$counts)
#找到x轴取值范围
X=c(h1$breaks,h2$breaks)
xmax=max(X)
xmin=min(X)

plot(h1,ylim = c(hmin,hmax),col='green',
     xlim = c(xmin,xmax),
     main = '背靠背直方图')
#用低级绘图函数将h2添加上去。
lines(h2,col='blue')
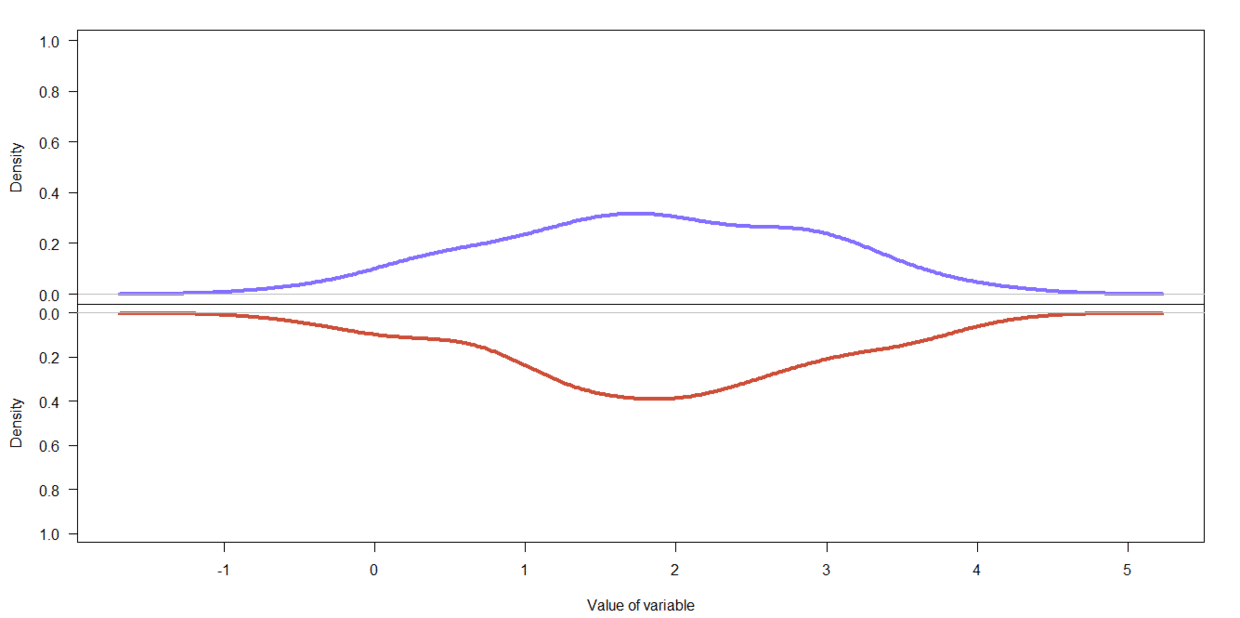
镜面图(mirror plot)
与背靠背直方图类似,只是展示的是概率密度曲线或其他曲线,而非条柱。
x1=rnorm(100)
x2=rnorm(100,mean = 2)
par(mfrow=c(2,1))

#设置第一张画布大小,为在同一张画布中容下两张图
par(mar=c(0,5,3,3))
plot(density(x1),main = "",xlab = "",
     ylim=c(0,1),xaxt="n", #是否设置x轴,n不绘制
las=1,col='slateblue1',lwd=4)

#设置第二张画布大小
par(mar=c(5,5,0,3))
plot(density(x2),main = "",xlab = "Value of variable",
     ylim=c(1,0), #范围应与第一张一致
     las=1,col='tomato3',lwd=4)
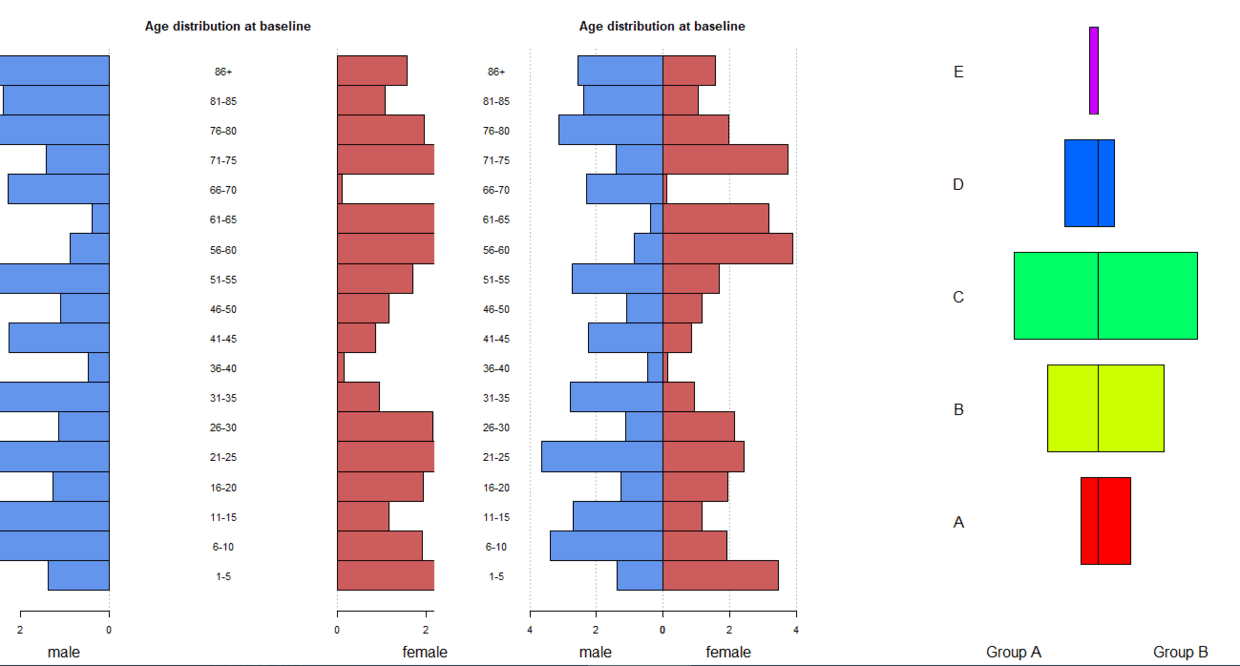
4.金字塔图
如展示不同年龄组男女人口数的分布情况。
library(DescTools)
par(mfrow=c(1,3))
m.pop <- runif(18,0,4)
f.pop <- runif(18,0,4)
age <- c('1-5','6-10','11-15','16-20','21-25','26-30',
         '31-35','36-40','41-45','46-50','51-55','56-60',
         '61-65','66-70','71-75','76-80','81-85','86+')
#左侧图
DescTools::PlotPyramid(m.pop,f.pop,
            ylab=age,space=0,
            col=c('cornflowerblue','indianred'),
            main='Age distribution at baseline',
            lxlab='male',rxlab='female') #左右两边x轴标签
#中间图
PlotPyramid(m.pop,f.pop,
            ylab = age,space=0,
            col=c('cornflowerblue','indianred'),
            xlim=c(-5,5),
            main = 'Age distribution at baseline',
            lxlab='male',rxlab='female',
            gapwidth = 0,ylab.x = -5)#将y轴移到x=-5位置,无gap
#右侧图
PlotPyramid(c(1,3,5,2,0.5),c(2,4,6,1,0),
            ylab = LETTERS[1:5],space=0.3, #每个条柱左边留一定空隙
            col=rep(rainbow(5),each=2),
            xlim = c(-10,10),args.grid = NA,
            cex.names = 1.5,adj = 1,
            lxlab = 'Group A',rxlab = 'Group B',
            gapwidth = 0,ylab.x = -8,xaxt = 'n')
