WGCNA分析基于两个假设:1.相似表达模式的基因可能存在共调控、功能相关或处于同一通路,2.基因网络符合无尺度分布。基于这两点,可以将基因网络根据表达相似性划分为不同的模块进而找出枢纽基因。
基本分析流程:
1. 首先看下样本数据,共35个样本,12328个基因,行是样本,列是基因:
rm(list=ls())
library(WGCNA)
library(data.table)
library(stringr)
library(openxlsx)

allowWGCNAThreads()
ALLOW_WGCNA_THREADS=4
memory.limit(size = 20000)
# 查看部分样本数据和性状数据:
multiExpr[[1]]$data[1:5,1:5]
datTraits[1:5,1:5]
然后是样本性状数据,行是样本,列是样本性状:
2. 查看样本数据是否完整:
# 检查数据是否正确:
exprSize = checkSets(multiExpr)
# 统计样本数量和基因数量:
nGenes = exprSize$nGenes;
nSamples = exprSize$nSamples;
# 检查所有基因和样本的缺失值是否足够低。
gsg = goodSamplesGenesMS(multiExpr, verbose = 3);
gsg$allOK
结果是OK,不OK得对样本数据进行校正。
3.选择一个β值建立临近矩阵根据连接度使我们的基因分布符合无尺度网络:
# 设定软阈值范围
powers = c(c(1:10), seq(from = 12, to=20, by=2))
# 获得各个阈值下的 R方 和平均连接度
sft = pickSoftThreshold(multiExpr[[1]]$data, powerVector = powers, verbose = 5)
# 作图:
sizeGrWindow(9, 5)
par(mfrow = c(1,2));
cex1 = 0.9;
# Scale-free topology fit index as a function of the soft-thresholding power
plot(sft$fitIndices[,1], -sign(sft$fitIndices[,3])*sft$fitIndices[,2],
     xlab="Soft Threshold (power)",ylab="Scale Free Topology Model Fit,signed R^2",type="n",
     main = paste("Scale independence"));
text(sft$fitIndices[,1], -sign(sft$fitIndices[,3])*sft$fitIndices[,2],
     labels=powers,cex=cex1,col="red");
# this line corresponds to using an R^2 cut-off of h
abline(h=0.90,col="red")
# Mean connectivity as a function of the soft-thresholding power
plot(sft$fitIndices[,1], sft$fitIndices[,5],
     xlab="Soft Threshold (power)",ylab="Mean Connectivity", type="n",
     main = paste("Mean connectivity"))
text(sft$fitIndices[,1], sft$fitIndices[,5], labels=powers, cex=cex1,col="red")
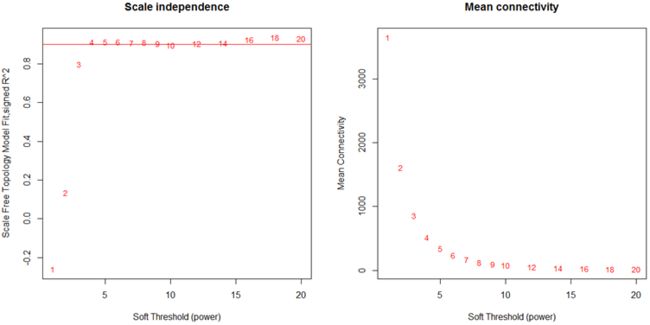
左图:Soft Threshold (power)表示权重,纵坐标表示连接度k与p(k)的相关性。右图:Soft Threshold (power)表示权重,纵坐标表示平均连接度。一般要求k与p(k)的相关性达到0.85时的power作为β值,可以看出本次示例中 β=4
4.根据β值获得临近矩阵和拓扑矩阵,
# 获得临近矩阵:
softPower <- sft$powerEstimate
adjacency = adjacency(multiExpr[[1]]$data, power = softPower);
# 将临近矩阵转为 Tom 矩阵
TOM = TOMsimilarity(adjacency);
# 计算基因之间的相异度
dissTOM = 1-TOM
hierTOM = hclust(as.dist(dissTOM),method="average");
5.检验选定的β值下记忆网络是否逼近 scale free
# ADJ1_cor <- abs(WGCNA::cor( multiExpr[[1]]$data,use = "p" ))^softPower
# 基因少(<5000)的时候使用下面的代码:
k <- as.vector(apply(ADJ1_cor,2,sum,na.rm=T))
# 基因多的时候使用下面的代码:
k <- softConnectivity(datE=multiExpr[[1]]$data,power=softPower)
sizeGrWindow(10, 5)
par(mfrow=c(1,2))
hist(k)
scaleFreePlot(k,main="Check Scale free topology\n")
可以看出k与p(k)成负相关(相关性系数0.9),说明选择的β值能够建立基因无尺度网络。
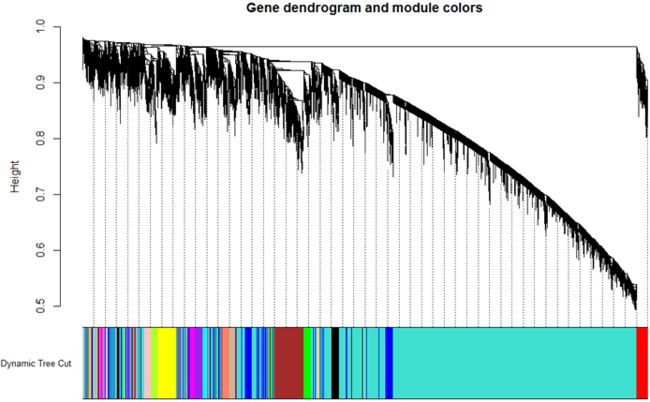
6.对刚才得到的拓扑矩阵使用相异度dissimilarity between genes对基因进行聚类,然后使用动态剪切法对树进行剪切成不同的模块(模块最小基因数为30):
# 使用相异度来聚类为gene tree(聚类树):
geneTree = hclust(as.dist(dissTOM), method = "average");
# Plot the resulting clustering tree (dendrogram)
windows()
sizeGrWindow(12,9)
plot(geneTree, xlab="", sub="", main = "Gene clustering on TOM-based dissimilarity",
     labels = FALSE, hang = 0.04);
# 使用动态剪切树挖掘模块:
minModuleSize = 30;
# 动态切割树:
dynamicMods = cutreeDynamic(dendro = geneTree, distM = dissTOM,
                            deepSplit = 2, pamRespectsDendro = FALSE,
                            minClusterSize = minModuleSize);
table(dynamicMods)
共15个modules
7.随机选择400个基因画拓扑重叠热图,图中行和列都表示单个基因,深黄色和红色表示高度的拓扑重叠。
# 拓扑热图:
nSelect = 400
# For reproducibility, we set the random seed
set.seed(10);
select = sample(nGenes, size = nSelect);
selectTOM = dissTOM[select, select];
# There's no simple way of restricting a clustering tree to a subset of genes, so we must re-cluster.
selectTree = hclust(as.dist(selectTOM), method = "average")
selectColors = dynamicColors[select];
# Open a graphical window
sizeGrWindow(9,9)
# Taking the dissimilarity to a power, say 10, makes the plot more informative by effectively changing
# the color palette; setting the diagonal to NA also improves the clarity of the plot
plotDiss = selectTOM^softPower;
diag(plotDiss) = NA;
TOMplot(plotDiss,
        selectTree,
        selectColors,
        main = "Network heatmap plot, selected genes")
8. 计算每个模块的特征向量基因,为某一特定模块第一主成分基因E。代表了该模块内基因表达的整体水平
MEList = moduleEigengenes(multiExpr[[1]]$data, colors = dynamicColors)
MEs = MEList$eigengenes
# 计算根据模块特征向量基因计算模块相异度:
MEDiss = 1-cor(MEs);
# Cluster module eigengenes
METree = hclust(as.dist(MEDiss), method = "average");
# Plot the result
特征向量基因临近热图:
plotEigengeneNetworks(MEs,
                      "Eigengene adjacency heatmap",
                      marHeatmap = c(3,4,2,2),
                      plotDendrograms = FALSE,
                      xLabelsAngle = 90)
画出指定模块表达量热图与特征向量基因柱状图,可以看出特征向量基因ME的表达与整个模块内基因的表达高度相关:
# 画出指定模块表达量的热图:
which.module=Freq_MS_max$GS_color;
ME=mergedMEs[, paste("ME",which.module, sep="")]
par(mfrow=c(2,1), mar=c(0,4.1,4,2.05))
plotMat(t(scale(multiExpr[[1]]$data[,colorh1==which.module ]) ),
        nrgcols=30,rlabels=F,rcols=which.module,
        main=which.module, cex.main=2)
par(mar=c(2,2.3,0.5,0.8))
barplot(ME, col=which.module, main="", cex.main=2,
        ylab="eigengene expression",xlab="array sample")
特征向量基因聚类树状图,红线以下的模块表示相关性>0.8,将被合并。
plot(METree,
     main = "Clustering of module eigengenes",
     xlab = "",
     sub = "")
# 在聚类图中画出剪切线
abline(h=MEDissThres, col = "red")
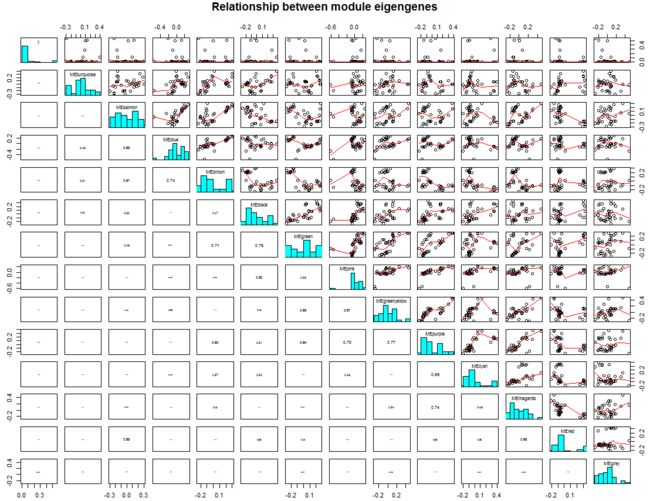
特征向量基因关联图:
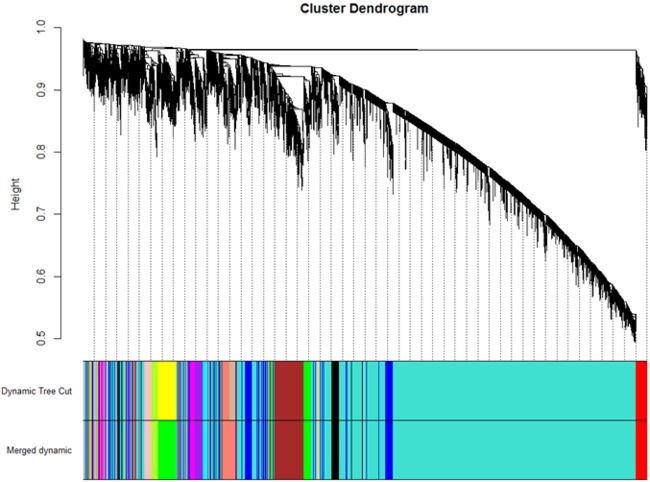
9. 将相关性系数大于0.8的模块合并掉,即相异性系数小于0.2:(本次合并掉2个模块)
MEDissThres = 0.2
# 在聚类图中画出剪切线
abline(h=MEDissThres, col = "red")
# 合并模块:
merge_modules = mergeCloseModules(multiExpr[[1]]$data, dynamicColors, cutHeight = MEDissThres, verbose = 3)
# 合并后的颜色:
mergedColors = merge_modules$colors;
# 新模块的特征向量基因:
mergedMEs = merge_modules$newMEs;
plotDendroAndColors(geneTree, cbind(dynamicColors, mergedColors),
                    c("Dynamic Tree Cut", "Merged dynamic"),
                    dendroLabels = FALSE, hang = 0.03,
                    addGuide = TRUE, guideHang = 0.05)
10. 样本聚类图与样本性状热图:
# 画出样本聚类图(上)与样本性状热图(下):
traitColors = numbers2colors(datTraits, signed = TRUE,centered=TRUE);
plotDendroAndColors(sampleTrees[[set]],
                    traitColors,
                    groupLabels = names(datTraits),
                    rowTextAlignment = "right-justified",
                    addTextGuide = TRUE ,
                    hang = 0.03,
                    dendroLabels = NULL, # 是否显示树labels
                    addGuide = FALSE,  # 显示虚线
                    guideHang = 0.05,
                    main = "Sample dendrogram and trait heatmap")
11. 模块与样本性状相关性热图,行表示模块,列表示性状。方块里的值表示相关性和pvalue.
moduleTraitCor_noFP <- cor(mergedMEs, datTraits[,1:14], use = "p");
moduleTraitPvalue_noFP = corPvalueStudent(moduleTraitCor_noFP, nSamples);
textMatrix_noFP <- paste(signif(moduleTraitCor_noFP, 2), "\n(", signif(moduleTraitPvalue_noFP, 1), ")", sep = "");
par(mar = c(10, 8.5, 3, 3));
labeledHeatmap(Matrix = moduleTraitCor_noFP,
               xLabels = names(datTraits[,1:14]),
               yLabels = names(mergedMEs),
               ySymbols = names(mergedMEs),
               colorLabels = FALSE,
               colors = blueWhiteRed(50),
               textMatrix = textMatrix_noFP,
               setStdMargins = FALSE,
               cex.text = 0.65,
               zlim = c(-1,1),
               main = paste("Module-trait relationships"))
12. 根据性状与模块特征向量基因的相关性及pvalue来挖掘与性状相关的模块
cor_ADR <- signif(WGCNA::cor(datTraits,mergedMEs,use="p",method="pearson"),5)
p.values <- corPvalueStudent(cor_ADR,nSamples=nrow(datTraits))
选择除去grey模块外相关系数最高pvalue最小的那个模块(grey表示未划分到任一模块的基因):
Freq_MS_max_cor <- which.max(abs(cor_ADR["Freq",-which(colnames(cor_ADR) == "MEgrey")]))
Freq_MS_max_p <- which.min(p.values["Freq",-which(colnames(p.values) == "MEgrey")])
可以看出结果都是第9个模块, greenyellow:
13. 根据基因网络显著性,也就是性状与每个基因表达量相关性在各个模块的均值作为该性状在该模块的显著性,显著性最大的那个模块与该性状最相关:
GS1 <- as.numeric(WGCNA::cor(datTraits[,i],multiExpr[[1]]$data,use="p",method="pearson"))
# 显著性是绝对值:
GeneSignificance <- abs(GS1)
# 获得该性状在每个模块中的显著性:
ModuleSignificance <- tapply(GeneSignificance,mergedColors,mean,na.rm=T)
可以看出,上面两种方法得到的结果相同,与性状最相关的模块是
greenyellow.
14. 寻找与该性状相关的枢纽基因(hub genes),首先计算基因的内部连接度和模块身份,内部连接度衡量的是基因在模块内部的地位,而模块身份表明基因属于哪个模块。
# 计算每个基因模块内部连接度,也就是基因直接两两加权相关性。
ADJ1=abs(cor(multiExpr[[1]]$data,use="p"))^softPower
# 根据上面结果和基因所属模块信息获得连接度:
# 整体连接度 kTotal,模块内部连接度:kWithin,kOut=kTotal-kWithin, kDiff=kIn-kOut=2*kIN-kTotal
Alldegrees1=intramodularConnectivity(ADJ1, colorh1)

# 注意模块内基于特征向量基因连接度评估模块内其他基因: de ne a module eigengene-based connectivity measure for each gene as the correlation between a the gene expression and the module eigengene
# 如 brown 模块内:kM Ebrown(i) = cor(xi, MEbrown) , xi is the gene expression pro le of gene i and M Ebrown is the module eigengene of the brown module
# 而 module membership 与内部连接度不同。MM 衡量了基因在全局网络中的位置。
datKME=signedKME(multiExpr[[1]]$data, datME, outputColumnName="MM.")
查看内部连接度和 MM直接的关系,以brown为例
which.color=Freq_MS_max$GS_color;
restrictGenes=colorh1==which.color
verboseScatterplot(Alldegrees1$kWithin[ restrictGenes],
                   (datKME[restrictGenes, paste("MM.", which.color, sep="")])^4,
                   col=which.color,
                   xlab="Intramodular Connectivity",
                   ylab="(Module Membership)^4")
可以看出内部连接度与模块身份高度相关。
我们使用3个标准来筛选枢纽基因:基因与指定模块显著性 > 0.2, greenyellow Module membership value > 0.8, q.weighted < 0.01
GS_spe <-  as.numeric(apply(multiExpr[[1]]$data,2,function(x){
    biserial.cor(x,datTraits[,trait_minP$trait[i]])
  }))
  GeneSignificance_spe <- abs(GS_spe)
  # 基于显著性和MM计算每个基因与 指定trait 的关联,结果包括p, q, cor, z,
  NS1=networkScreening(y=allTraits[,trait_minP$trait[[i]]],
                       datME=datME,
                       datExpr=multiExpr[[1]]$data,
                       oddPower=3,
                       blockSize=1000,
                       minimumSampleSize=4,
                       addMEy=TRUE,
                       removeDiag=FALSE,
                       weightESy=0.5)
  rownames(NS1) <- colnames(multiExpr[[1]]$data)

  # 根据 基因与指定性状的直接相关性(biserial.cor),模块身份,和加权相关性 筛选基因:
  FilterGenes_spe = ((GeneSignificance_spe > 0.2) & (abs(datKME[paste("MM.",Freq_MS_max$GS_color,sep="")])>0.8) & (NS1$q.Weighted < 0.01) )
  table(FilterGenes_spe)
# 找到满足上面条件的基因:
  trait_hubGenes_spe <- colnames(multiExpr[[1]]$data)[FilterGenes_spe]
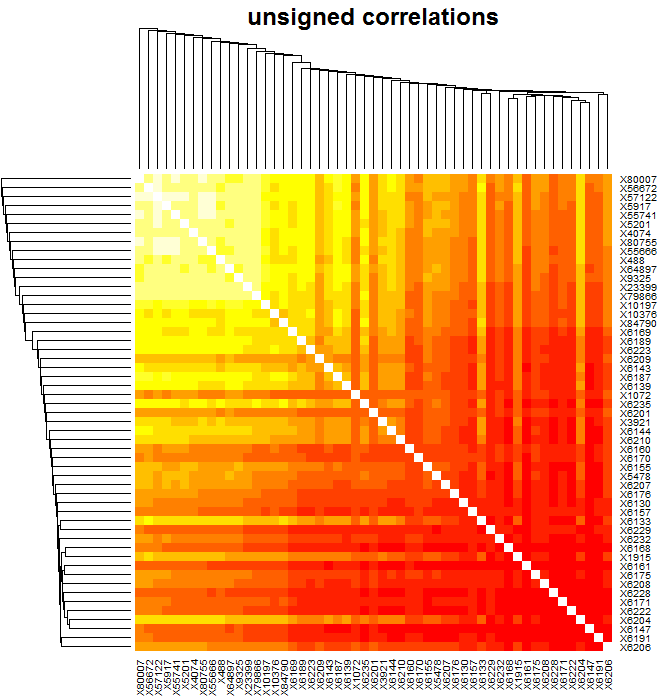
符合上述条件的枢纽基因有53个:
这些基因的拓扑重叠热图,颜色越深表示拓扑重叠度越高。
# hub 基因热图:
  plotNetworkHeatmap(multiExpr[[1]]$data,
                     plotGenes = paste("X",trait_hubGenes_spe,sep = ""),
                     networkType = "unsigned",
                     useTOM = TRUE,
                     power=softPower,
                     main="unsigned correlations")
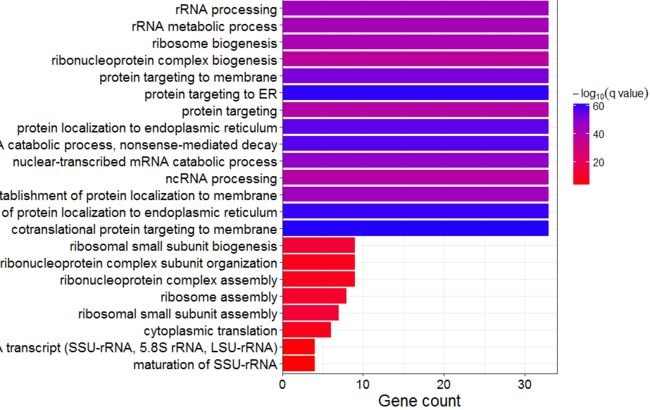
15. hub genes GO and KEGG analysis.
library(clusterProfiler)
library(org.Hs.eg.db)
library(ggplot2)
# GO 分析:
ego <- enrichGO(gene          = trait_hubGenes_spe,
                # universe      = names(geneList),
                OrgDb         = org.Hs.eg.db,
                ont           = "BP",
                pAdjustMethod = "BH",
                pvalueCutoff  = 0.01,
                qvalueCutoff  = 0.05,
                readable      = TRUE)

GO_BP <- as.data.frame(ego)
GO_BP$point_shape<-"0"
GO_BP$point_size<-"15"
# write.xlsx(GO_BP,"./results/392_genes_GO_BP.xlsx")

ggplot(data=GO_BP)+
  geom_bar(aes(x=reorder(Description,Count),y=Count, fill=-log10(qvalue)), stat='identity') +
  coord_flip() +
  scale_fill_gradient(expression(-log["10"]("q value")),low="red", high = "blue") +
  xlab("") +
  ylab("Gene count") +
  scale_y_continuous(expand=c(0, 0))+
  theme_bw()+
  theme(
    axis.text.x=element_text(color="black",size=rel(1.5)),
    axis.text.y=element_text(color="black", size=rel(1.6)),
    axis.title.x = element_text(color="black", size=rel(1.6)),
    legend.text=element_text(color="black",size=rel(1.0)),
    legend.title = element_text(color="black",size=rel(1.1))
    # legend.position=c(0,1),legend.justification=c(-1,0)
    # legend.position="top",
  )
KEGG 分析:
# KEGG:
kk <- enrichKEGG(gene         = trait_hubGenes_spe,
                 organism     = 'hsa',
                 pvalueCutoff = 0.05)
kegg_DF <- as.data.frame(kk)
15. 导出 hub genes 为 Cytoscape 和 visant 可以识别的格式并作图:
# 导出整个模块基因到 VisANT
modTOM <- TOM[mergedColors==Freq_MS_max$GS_color,mergedColors==Freq_MS_max$GS_color]
dimnames(modTOM) = list(colnames(multiExpr[[1]]$data)[mergedColors==Freq_MS_max$GS_color], colnames(multiExpr[[1]]$data)[mergedColors==Freq_MS_max$GS_color])
vis = exportNetworkToVisANT(modTOM,
                              file = paste("./WGCNA/ADR_drug_exp_new/VisANTInput-Mod-", Freq_MS_max$GS_color, ".txt", sep=""),
                              weighted = TRUE,
                              threshold = 0
                              # probeToGene = data.frame(annot$substanceBXH, annot$gene_symbol)
                              )

# 导出枢纽基因到 Cytoscape
hubGene_TOM <- TOM[FilterGenes_spe,FilterGenes_spe]
dimnames(hubGene_TOM) = list(colnames(multiExpr[[1]]$data)[FilterGenes_spe], colnames(multiExpr[[1]]$data)[FilterGenes_spe])
cyt = exportNetworkToCytoscape(hubGene_TOM,
                                 edgeFile = paste("./WGCNA/ADR_drug_exp_new/CytoscapeInput-edges-", paste(Freq_MS_max$GS_color, collapse="-"), ".txt", sep=""),
                                 nodeFile = paste("./WGCNA/ADR_drug_exp_new/CytoscapeInput-nodes-", paste(Freq_MS_max$GS_color, collapse="-"), ".txt", sep=""),
                                 weighted = TRUE,
                                 threshold = 0.02,
                                 nodeNames = trait_hubGenes_spe,
                                 altNodeNames = trait_hubGenes_spe,
                                 nodeAttr = mergedColors[FilterGenes_spe]
                                 )
更多原创精彩视频敬请关注生信杂谈:


