前面我们了解了决策树和adaboost的决策树墩的原理和实现,在adaboost我们看到,用简单的决策树墩的效果也很不错,但是对于更多特征的样本来说,可能需要很多数量的决策树墩
或许我们可以考虑使用更加高级的弱分类器,下面我们看下CART(Classification And Regression Tree)的原理和实现吧
CART也是决策树的一种,不过是满二叉树,CART可以是强分类器,就跟决策树一样,但是我们可以指定CART的深度,使之成为比较弱的分类器
CART生成的过程和决策树类似,也是采用递归划分的,不过也存在很多的不同之处
数据集:第一列为样本名称,最后一列为类别,中间为特征
human    constant    hair    true    false    false    false    true    false    mammal
python    cold_blood    scale    false    true    false    false    false    true    reptile
salmon    cold_blood    scale    false    true    false    true    false    false    fish
whale    constant    hair    true    false    false    true    false    false    mammal
frog    cold_blood    none    false    true    false    sometime    true    true    amphibious
lizard    cold_blood    scale    false    true    false    false    true    false    reptile
bat    constant    hair    true    false    true    false    true    false    mammal
cat    constant    skin    true    false    false    false    true    false    mammal
shark    cold_blood    scale    true    false    false    true    false    false    fish
turtle    cold_blood    scale    false    true    false    sometime    true    false    reptile
pig    constant    bristle    true    false    false    false    true    true    mammal
eel    cold_blood    scale    false    true    false    true    false    false    fish
salamander    cold_blood    none    false    true    false    sometime    true    true    amphibious
特征名称如下
["temperature","cover","viviparity","egg","fly","water","leg","hibernate"]
1:数据集划分评分
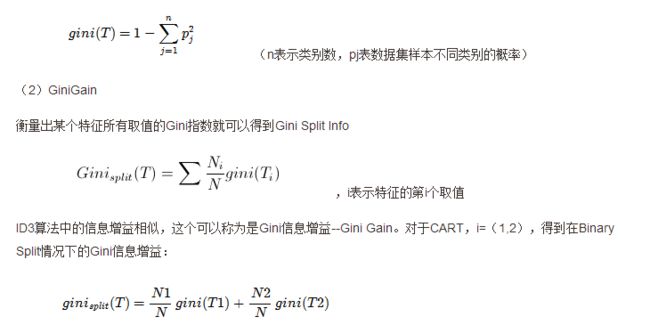
CART使用gini系数来衡量数据集的划分效果而不是香农熵(借用下面的一张图)
def calGini(dataSet):
    numEntries = len(dataSet)
    labelCounts={}
    for featVec in dataSet:
        currentLabel = featVec[-1]
        if currentLabel not in labelCounts.keys(): labelCounts[currentLabel] = 0
        labelCounts[currentLabel] += 1
    gini=1
    for label in labelCounts.keys():
        prop=float(labelCounts[label])/numEntries
        gini -=prop*prop
    return gini
2:数据集划分
决策树是遍历每一个特征的特征值,每个特征值得到一个划分,然后计算每个特征的信息增益从而找到最优的特征;
CART每一个分支都是二分的,当特征值大于两个的时候,需要考虑特征值的组合得到两个“超级特征值”作为CART的分支;当然我们也可以偷懒,每次只取多个特征值的一个,挑出最优的一个和剩下的分别作为一个分支,但无疑这得到的cart不是最优的
# 传入的是一个特征值的列表,返回特征值二分的结果
def featuresplit(features):
    count = len(features)#特征值的个数
    if count < 2:
        print "please check sample's features,only one feature value"
        return -1
    # 由于需要返回二分结果,所以每个分支至少需要一个特征值,所以要从所有的特征组合中选取1个以上的组合
    # itertools的combinations 函数可以返回一个列表选多少个元素的组合结果,例如combinations(list,2)返回的列表元素选2个的组合
    # 我们需要选择1-(count-1)的组合
    featureIndex = range(count)
    featureIndex.pop(0)
    combinationsList = []
    resList=[]
    # 遍历所有的组合
    for i in featureIndex:
        temp_combination = list(combinations(features, len(features[0:i])))
        combinationsList.extend(temp_combination)
        combiLen = len(combinationsList)
    # 每次组合的顺序都是一致的,并且也是对称的,所以我们取首尾组合集合
    # zip函数提供了两个列表对应位置组合的功能
    resList = zip(combinationsList[0:combiLen/2], combinationsList[combiLen-1:combiLen/2-1:-1])
    return resList
得到特征的划分结果之后,我们使用二分后的特征值划分数据集
def splitDataSet(dataSet, axis, values):
    retDataSet = []
    for featVec in dataSet:
        for value in values:
            if featVec[axis] == value:
                reducedFeatVec = featVec[:axis]     #剔除样本集
                reducedFeatVec.extend(featVec[axis+1:])
                retDataSet.append(reducedFeatVec)
    return retDataSet
遍历每个特征的每个二分特征值,得到最好的特征以及二分特征值
# 返回最好的特征以及二分特征值
def chooseBestFeatureToSplit(dataSet):
    numFeatures = len(dataSet[0]) - 1      #
    bestGiniGain = 1.0; bestFeature = -1;bestBinarySplit=()
    for i in range(numFeatures):        #遍历特征
        featList = [example[i] for example in dataSet]#得到特征列
        uniqueVals = list(set(featList))       #从特征列获取该特征的特征值的set集合
        # 三个特征值的二分结果:
        # [(('young',), ('old', 'middle')), (('old',), ('young', 'middle')), (('middle',), ('young', 'old'))]
        for split in featuresplit(uniqueVals):
            GiniGain = 0.0
            if len(split)==1:
                continue
            (left,right)=split
            # 对于每一个可能的二分结果计算gini增益
            # 左增益
            left_subDataSet = splitDataSet(dataSet, i, left)
            left_prob = len(left_subDataSet)/float(len(dataSet))
            GiniGain += left_prob * calGini(left_subDataSet)
            # 右增益
            right_subDataSet = splitDataSet(dataSet, i, right)
            right_prob = len(right_subDataSet)/float(len(dataSet))
            GiniGain += right_prob * calGini(right_subDataSet)
            if (GiniGain <= bestGiniGain):       #比较是否是最好的结果
                bestGiniGain = GiniGain         #记录最好的结果和最好的特征
                bestFeature = i
                bestBinarySplit=(left,right)
    return bestFeature,bestBinarySplit
所有特征用完时多数表决程序
def majorityCnt(classList):
    classCount={}
    for vote in classList:
        if vote not in classCount.keys(): classCount[vote] = 0
        classCount[vote] += 1
    sortedClassCount = sorted(classCount.iteritems(), key=operator.itemgetter(1), reverse=True)
    return sortedClassCount[0][0]
现在来生成cart吧
def createTree(dataSet,labels):
    classList = [example[-1] for example in dataSet]
    # print dataSet
    if classList.count(classList[0]) == len(classList):
        return classList[0]#所有的类别都一样,就不用再划分了
    if len(dataSet) == 1: #如果没有继续可以划分的特征,就多数表决决定分支的类别
        # print "here"
        return majorityCnt(classList)
    bestFeat,bestBinarySplit = chooseBestFeatureToSplit(dataSet)
    # print bestFeat,bestBinarySplit,labels
    bestFeatLabel = labels[bestFeat]
    if bestFeat==-1:
        return majorityCnt(classList)
    myTree = {bestFeatLabel:{}}
    featValues = [example[bestFeat] for example in dataSet]
    uniqueVals = list(set(featValues))
    for value in bestBinarySplit:
        subLabels = labels[:]       # #拷贝防止其他地方修改
        if len(value)<2:
            del(subLabels[bestFeat])
        myTree[bestFeatLabel][value] = createTree(splitDataSet(dataSet, bestFeat, value),subLabels)
    return myTree
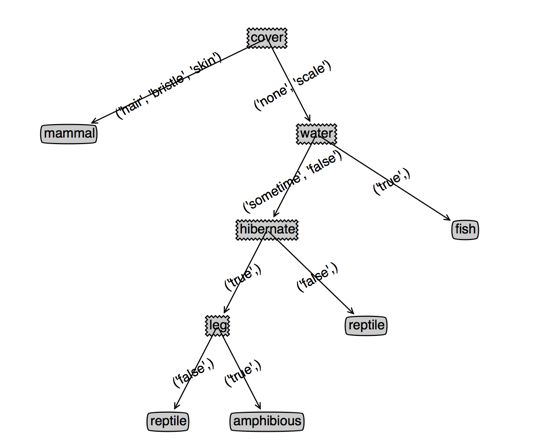
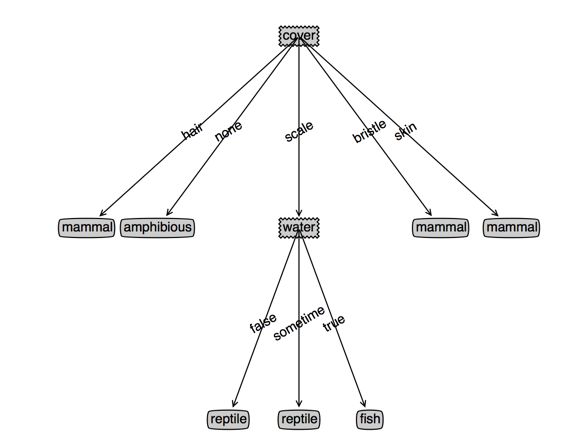
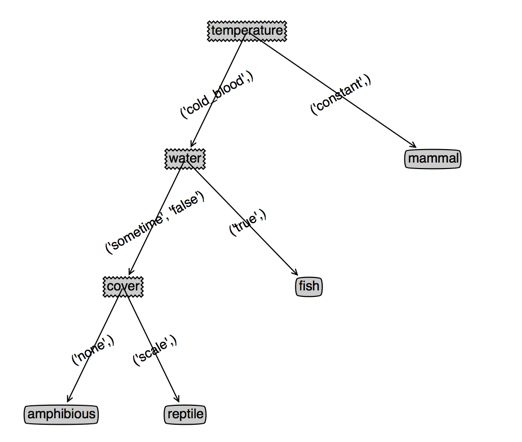
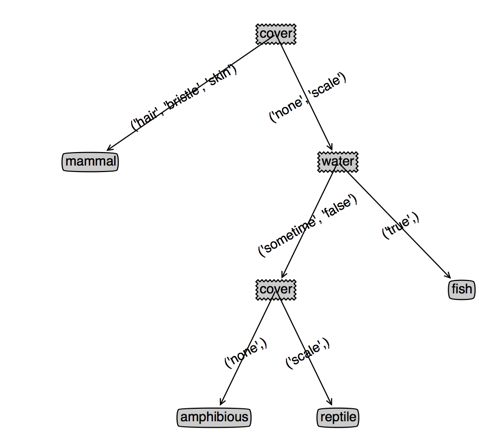
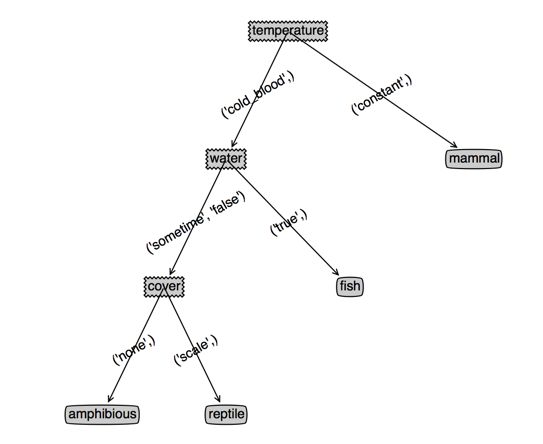
看下效果,左边是cart,右边是决策树,(根节点用cover和temperature是一样的,为了对比决策树,此时我选了cover),第三个图是temperature作为根节点的cart
上面的代码是不考虑特征继续使用的,也就是每个特征只使用一次;但是我们发现有些有些分支里面特征值个数多余两个的,其实我们应该让这些特征继续参与下一次的划分
可以发现,temperature作为根节点的cart没有变化,而cover作为根节点的cart深度变浅了,并且cover特征出现了两次(或者说效果变好了)
下面是有变化的代码
特征值多余两个的分支保留特征值
def splitDataSet(dataSet, axis, values):
    retDataSet = []
    if len(values) < 2:
        for featVec in dataSet:
            if featVec[axis] == values[0]:#如果特征值只有一个,不抽取当选特征
                reducedFeatVec = featVec[:axis]
                reducedFeatVec.extend(featVec[axis+1:])
                retDataSet.append(reducedFeatVec)
    else:
        for featVec in dataSet:
            for value in values:
                if featVec[axis] == value:#如果特征值多于一个,选取当前特征
                    retDataSet.append(featVec)

    return retDataSet
createTree函数for循环判断是否需要移除当前最优特征
    for value in bestBinarySplit:
        if len(value)<2:
            del(labels[bestFeat])
        subLabels = labels[:]       #拷贝防止其他地方修改
        myTree[bestFeatLabel][value] = createTree(splitDataSet(dataSet, bestFeat, value),subLabels)
这样我们就生成了一个cart,但是这个数据集没有出现明显的过拟合的情景,我们换一下数据集看看
sunny    hot    high    FALSE    no
sunny    hot    high    TRUE    no
overcast    hot    high    FALSE    yes
rainy    mild    high    FALSE    yes
rainy    cool    normal    FALSE    yes
rainy    cool    normal    TRUE    no
overcast    cool    normal    TRUE    yes
sunny    mild    high    FALSE    no
sunny    cool    normal    FALSE    yes
rainy    mild    normal    FALSE    yes
sunny    mild    normal    TRUE    yes
overcast    mild    high    TRUE    yes
overcast    hot    normal    FALSE    yes
rainy    mild    high    TRUE    no
特征名称:"Outlook" , "Temperature" , "Humidity" , "Wind"
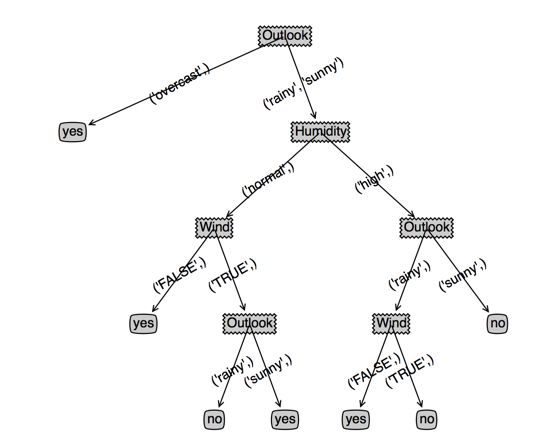
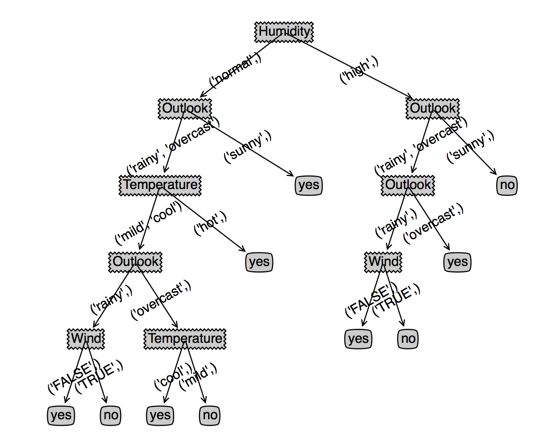
生成的cart比价合理,这是因为数据比较合理,我们添加一条脏数据看看cart会变成怎么样(右图),可以看到cart为了拟合我新加的这条脏数据,
树深度增加1,叶子节点增加3,不过另一方面也是因为样本数少的原因,一个噪声样本就产生了如此大的印象
overcast mild normal FALSE no
下一篇博客我们继续讨论cart连续值的生成以及剪枝的实验。
