matolotlib 基本图形绘制
from pandas import Series,DataFrame
import matplotlib.pyplot as plt
import numpy as np
import pandas as pd
下面先做两个例子绘折线图
Series生成图表
ts=Series(np.random.randn(120),index=pd.date_range('1/1/2018',periods=120))
ts=ts.cumsum()
ts.head()
    2018-01-01    0.732337
    2018-01-02    1.222352
    2018-01-03    0.460722
    2018-01-04    0.694276
    2018-01-05    0.394703
    Freq: D, dtype: float64
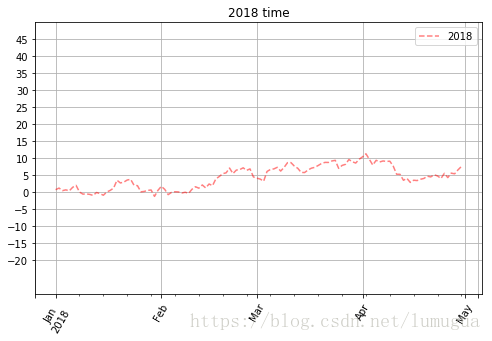
ts.plot(kind='line',
       title='2018 time',
       label='2018',
       style='--g',
       color='red',
       alpha=0.5,
       grid=True,
       rot=60,
       ylim=[-30,50],
       yticks=list(range(-20,50,5)),
       use_index=True,
       figsize=(8,5),
       legend=True)
DataFrame生成图表
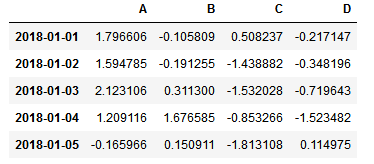
df=DataFrame(np.random.randn(120,4),index=pd.date_range('1/1/2018',periods=120),columns=list('ABCD'))
df=df.cumsum()
df.head()  #查看前五行数据
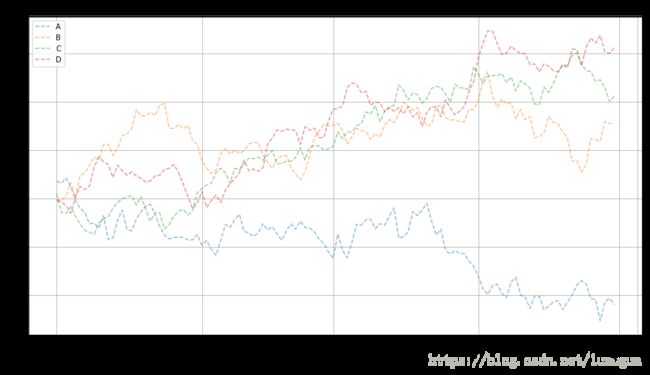
df.plot(kind='line',
       title='2018 time',
       label='2018',
       style='--',
       alpha=0.5,
       grid=True,
       rot=60,
       use_index=True,
       figsize=(15,8),
       fontsize='large',
       legend=True,
       subplots=False)
绘图标签总结:
#Series.plot() series的index为横坐标,value为纵坐标
#figsize:图像大小标签
#title:图像标题名称
#kind:line,bar 折线图、柱状图等形状设定
#label:为图例标签,DataFrame是列名为label图例标签
#style:风格字符串 包括linestyle,narker,color
#color:颜色
#alpha:透明度
#grid:图表网格
#xlim 、ylim:x,y轴界限
#xticks,yticks:x,y刻度值
#legend:是否显示图例 使用plt.legend
下面练习简单的图形绘制
1. 柱状图与 堆叠图
fig,axes=plt.subplots(4,1,figsize=(10,15)) #创建四个子图
df1=Series(np.random.randint(0,10,16),index=list('abcdefghijklmnop'))
df2=DataFrame(np.random.rand(10,3),columns=['a','b','c'])

#单系列图
df1.plot(kind='bar',grid=True,alpha=0.6,ax=axes[0])  #选择第一个子图

#多系列图
df2.plot(kind='bar',alpha=0.5,ax=axes[1]) #选择第二个子图

#多系列图和堆叠图
df2.plot(kind='bar',colormap='Blues_r',edgecolor='green',stacked=True,ax=axes[2])#选择第三个子图

df2.plot.barh(ax=axes[3])
2. 面积图
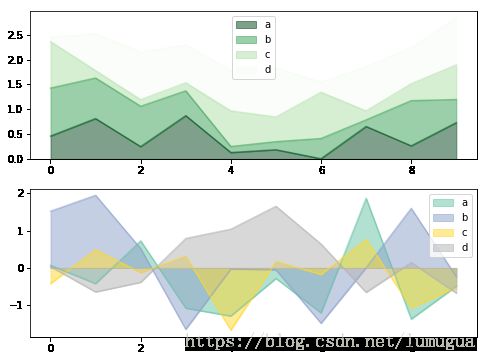
fig,axes=plt.subplots(2,1,figsize=(8,6))
df3=DataFrame(np.random.rand(10,4),columns=['a','b','c','d'])  #正值的数据
df4=DataFrame(np.random.randn(10,4),columns=['a','b','c','d'])  #正值和负值都有的数据

df3.plot.area(alpha=0.5,ax=axes[0],colormap='Greens_r')
df4.plot.area(stacked=False,colormap='Set2',alpha=0.5,ax=axes[1])

#stacked 是否堆叠,默认区域图是堆叠
#为了产生堆积面积图,每列需要是全部正值或者是全部是负值
#当数据有缺失na值时,会自动填充为0
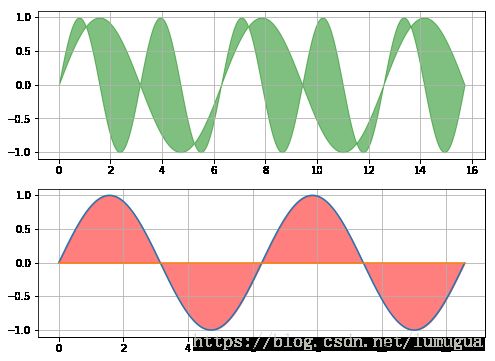
3. 填充图
fig,axes=plt.subplots(2,1,figsize=(8,6))
x=np.linspace(0,5*np.pi,1000)
y1=np.sin(x)
y2=np.sin(2*x)
axes[0].fill_between(x,y1,y2,color='g',alpha=0.5,label='area') #填充
axes[0].grid()

x2=np.arange(0.0,4.0*np.pi,0.01)
y2=np.sin(x2)
axes[1].plot(x2, y2)
axes[1].plot((x2.min(),x2.max()), (0,0)) #水平基准线
axes[1].fill_between(x2,y2,color='r',alpha=0.5)  #填充
axes[1].grid()
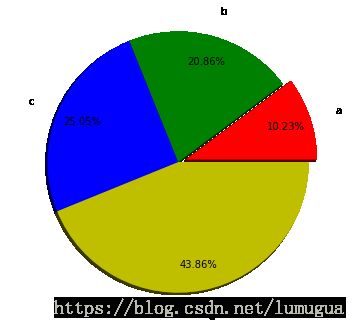
4. 饼图
s=Series(2*np.random.rand(4),index=['a','b','c','d'],name='series')
plt.axis('equal') #让图形的长和宽相等
plt.pie(s,colors=['r','g','b','y'],
        explode=[0.1,0,0,0],  #每部分的偏移量
        labels=s.index,
        autopct='%.2f%%',  # 饼图上的数据标签显示方式
        labeldistance=1.2, # 画饼标记的直径  默认1.1
        pctdistance=0.8,   # 每个切片的中心和通过autopct生成的文本开始之间的比例
        shadow=True,   #阴影
        startangle=0,   #开始角度
        radius=1.5,     #半径
        frame=False)

print(s)
a    0.435720
b    0.888153
c    1.066442
d    1.867224
Name: series, dtype: float64
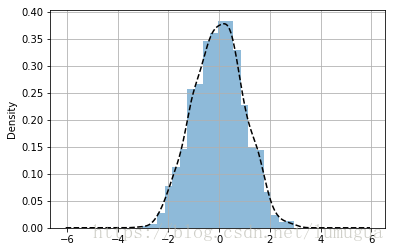
5. 直方图和密度图
s1=Series(np.random.randn(1000))
s1.hist(bins=20,             #箱子宽度
      histtype='bar',        #风格 bar ,step
      align='mid',           #对齐方式 left  mid right
      orientation='vertical',#水平还是垂直 horizontal ,vertical
      normed=True,       #标准化
       alpha=0.5)

#密度图
s1.plot(kind='kde',style='k--',grid=True)   #密度图时候    normed=True,
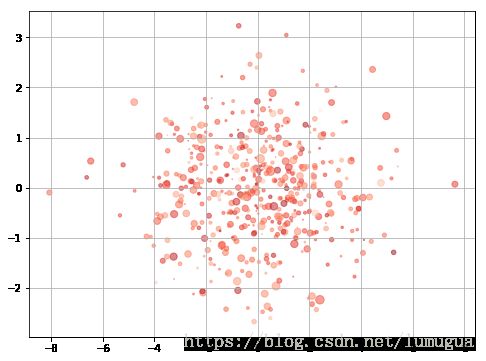
6. 散点图
plt.figure(figsize=(8,6))
x=2*np.random.randn(1000)
y=np.random.randn(1000)
plt.scatter(x,y,marker='.',
           s=np.random.randn(1000)*100,   #散点大小
           alpha=0.5,
            c=np.random.randn(1000)*100,  #散点颜色
           cmap='Reds')
plt.grid()
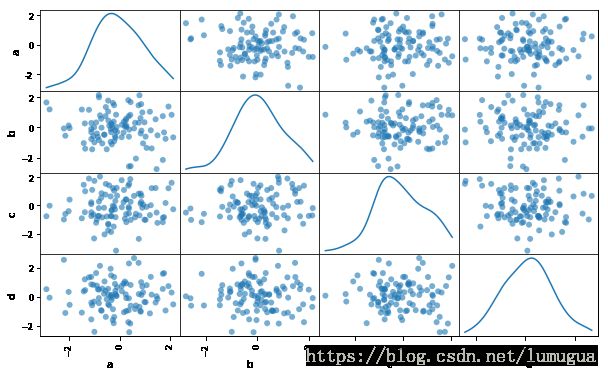
7. 矩阵散点图
ddf=DataFrame(np.random.randn(100,4),columns=['a','b','c','d'])
pd.plotting.scatter_matrix(ddf,figsize=(10,6),
                           marker='o',
                           diagonal='kde',#只能并且在 hist和kde 中选择一个,每个指标的频率图
                           range_padding=0.1, #图形在x轴和y轴原点的留白
                           alpha=0.6)
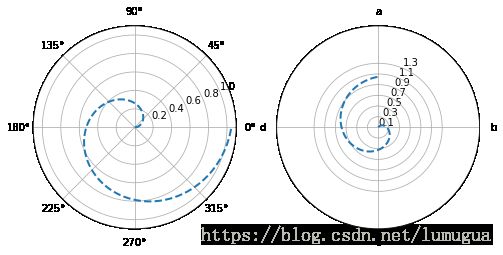
8. 极坐标图
##创建数据
s= Series(np.arange(20))
theta=np.arange(0,2*np.pi,0.02)
#print(s.head())
#print(theta[:60])

#创建子坐标
fig=plt.figure(figsize=(8,4))
ax1=plt.subplot(121,projection='polar')
ax2=plt.subplot(122,projection='polar')

#也可以这样创建ax=fig.add_subplot(111,polar=True)

ax1.plot(theta,theta/6,linestyle='--',lw=2)  #lw为线宽
#ax1.plot(s,linestyle='--',marker='.',lw=2)
ax2.plot(theta,theta/6,linestyle='--',lw=2)

#参数设定比较

#坐标轴正方向,默认逆时针方向
ax2.set_theta_direction(-1)

#设置极坐标角度网格线显示和标签 ,其中网格和标签数量一致
ax2.set_thetagrids(np.arange(0.0,360.0,90),['a','b','c','d'])

#设置网格线显示,参数必须为正数
ax2.set_rgrids(np.arange(0.2,2,0.2))

#设置角度偏移,逆时针  弧度
ax2.set_theta_offset(np.pi/2)

#设置极坐标半径范围
ax2.set_rlim(0.2,1.8)

ax2.set_rmax(2) #极坐标半径的最大值

ax2.set_rticks(np.arange(0.1,1.5,0.2)) #极坐标半径网格线的显示范围
9. 箱线图
fig,axes=plt.subplots(2,1,figsize=(10,6))
dff=DataFrame(np.random.rand(10,5),columns=['A','B','C','D','E'])
color=dict(boxes='DarkGreen',whiskers='DarkOrange',medians='DarkBlue',caps='Gray')

#boxes 箱线颜色
#whiskers 分位数与error bar横线之间竖线的颜色
#medians 中位数线颜色
#caps  横线颜色
dff.plot.box(ylim=[0,1.2],
            grid=True,
            color=color,
            ax=axes[0])

dff.plot.box(vert=False,        #vert 默认垂直,是否垂直
             positions=[1,4,9,8,6], #箱线图占位
            grid=True,
            color=color,
            ax=axes[1])
另外还有其他比较复杂的图形绘制和绘图参数的知识需要花时间熟悉进行学习,可以在matplotlib官网进行学习。
matplotlib官网网址:https://matplotlib.org/
