这一章听的不是很懂,主要还是平时可能用到的地方不多,网上看了一个例子,感觉还不错。一棵树由一系列结点和一系列连接结点的边组成。由列表表示的树如下:
In [35]: def binary_tree(r):
   ...:     return [r, [], []]
   ...: def insert_left(root, new_branch):
   ...:     t = root.pop(1)   # The left child position
   ...:     if len(t) > 1:   # if not empty
   ...:         # The origin left child turn to be the left child of new_branch
   ...:         root.insert(1, [new_branch, t, []])
   ...:     else:
   ...:         root.insert(1, [new_branch, [], []])
   ...:     return root
   ...: def insert_right(root, new_branch):
   ...:     t = root.pop(2)
   ...:     if len(t) > 1:
   ...:         root.insert(2, [new_branch, [], t])
   ...:     else:
   ...:         root.insert(2, [new_branch, [], []])
   ...:     return root
   ...: def get_root_val(root):
   ...:     return root[0]
   ...: def set_root_val(root, new_val):
   ...:     root[0] = new_val
   ...: def get_left_child(root):
   ...:     return root[1]
   ...: def get_right_child(root):
   ...:     return root[2]
   ...:

In [36]: x = binary_tree('a')
   ...: insert_left(x,'b')
   ...: insert_right(x,'c')
   ...: insert_right(get_right_child(x), 'd')  # important!
   ...: insert_left(get_right_child(get_right_child(x)), 'e')
   ...:
Out[36]: ['d', ['e', [], []], []]
绘图以及类的进一步扩展
这一章节讲的主要是pylab模块,而且讲的不够详细。而我平时接触到的更多的其实是matplotlib,具体是操作过程可以参见《利用Pyhon进行数据分析》以及,网络上的视频教程。
参考视频:
Python数据可视化分析 matplotlib教程
Matplotlib Python 画图教程 (莫烦Python)
Python数据可视化分析 matplotlib
书中的例子,手敲如下:
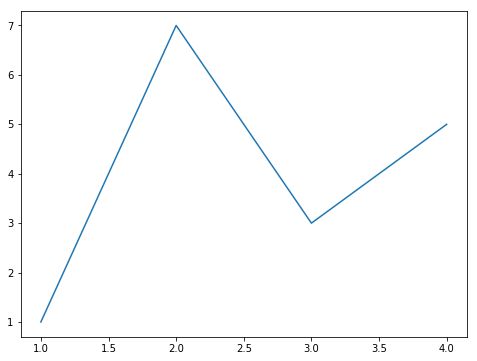
In [3]: import pylab

In [4]: pylab.figure(1)
   ...: pylab.plot([1,2,3,4],[1,7,3,5])
   ...: pylab.show()
   ...:
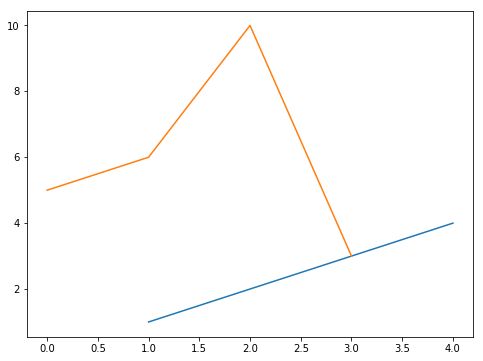
In [5]: pylab.figure(1)
   ...: pylab.plot([1,2,3,4], [1,2,3,4])
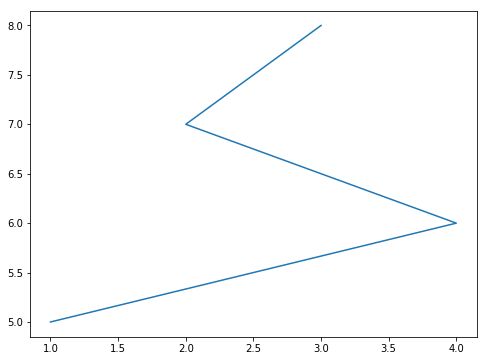
   ...: pylab.figure(2)
   ...: pylab.plot([1,4,2,3], [5,6,7,8])
   ...: pylab.savefig('Figure-Addie')
   ...: pylab.figure(1)
   ...: pylab.plot([5,6,10,3])
   ...: pylab.savefig('Figure-Jane')
   ...:
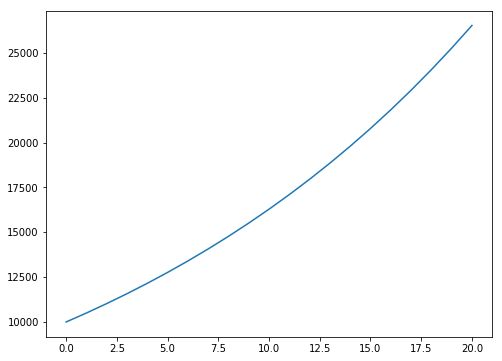
In [7]: principal = 10000 #初始投资
   ...: interestRate = 0.05
   ...: years = 20
   ...: values = []
   ...: for i in range(years + 1):
   ...:     values.append(principal)
   ...:     principal += principal*interestRate
   ...: pylab.plot(values)
   ...:
Out[7]: []
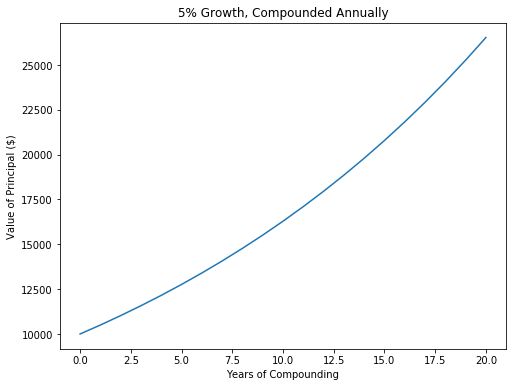
In [8]: principal = 10000 #初始投资
   ...: interestRate = 0.05
   ...: years = 20
   ...: values = []
   ...: for i in range(years + 1):
   ...:     values.append(principal)
   ...:     principal += principal*interestRate
   ...: pylab.plot(values)
   ...: pylab.title('5% Growth, Compounded Annually')
   ...: pylab.xlabel('Years of Compounding')
   ...: pylab.ylabel('Value of Principal ($)')
   ...:
Out[8]: Text(0,0.5,'Value of Principal ($)')
关于《利用Python进行数据分析》第8章绘图和可视化复习
主要注意以下技巧点:
1、Figure和Subplot,其中Subplot表示子图的意思。
2、颜色、标记和线形。
3、刻度、标签和图例。
4、设置标题、轴标签、刻度以及刻度标签。
5、添加图例。
6、注解以及在Subplot上绘图。
7、文件的保存
一、导入相关包
In [23]: from pandas import Series,DataFrame
In [26]: import numpy as np
In [27]: import pandas as pd
二、线形图
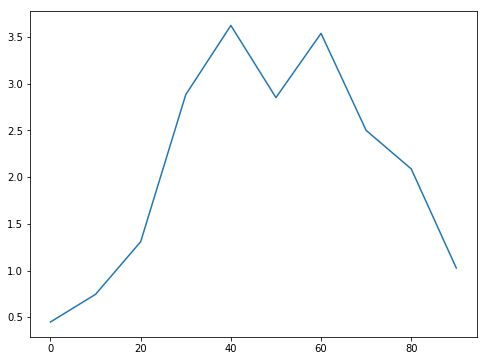
In [28]: s = Series(np.random.randn(10).cumsum(),index=np.arange(0,100,10))
In [30]: s.plot()
Out[30]:
In [32]: df = DataFrame(np.random.randn(10,4).cumsum(0),columns=['A','B','C','D'],
                      index = np.arange(0,100,10))

In [34]: df
Out[34]:
           A         B         C         D
0  -0.989531 -2.115333  0.869333 -0.912592
10 -0.610439 -2.252472 -0.341660 -1.992918
20 -0.346735 -3.405280 -1.292019 -1.220195
30 -0.794386 -4.347492 -1.352773 -0.573720
40 -1.623164 -3.324624  0.539607  0.759043
50 -2.233892 -4.262740  1.181381 -0.548779
60 -4.365038 -1.676428  1.883277 -0.400880
70 -4.531204 -2.335836  1.182581 -0.463981
80 -5.393352 -2.627742 -0.540208 -1.420075
90 -5.502896 -3.457975 -0.003414 -0.820583

In [35]: df.plot()
Out[35]:
三、柱状图
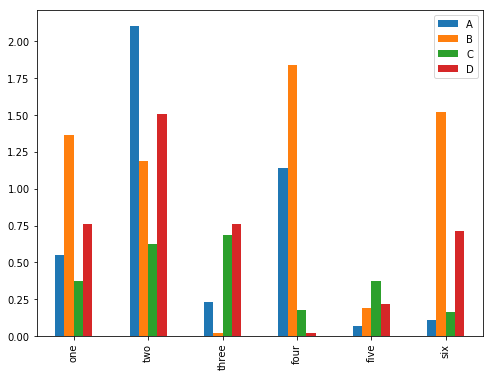
In [39]: df = DataFrame(abs(np.random.randn(6,4)),columns=pd.Index(['A','B','C','D']),
                    index = ['one','two','three','four','five','six'])
#注意加个abs()函数,将柱状图方向一致

In [39]:

In [40]: df
Out[40]:
              A         B         C         D
one    0.551014  1.364315  0.371038  0.760380
two    2.105145  1.188208  0.624236  1.503707
three  0.229816  0.018687  0.686012  0.762051
four   1.142801  1.837860  0.179224  0.018175
five   0.068223  0.189362  0.373415  0.217577
six    0.107417  1.518513  0.162553  0.715304

In [41]: df.plot(kind = 'bar')
Out[41]:
四、散点图
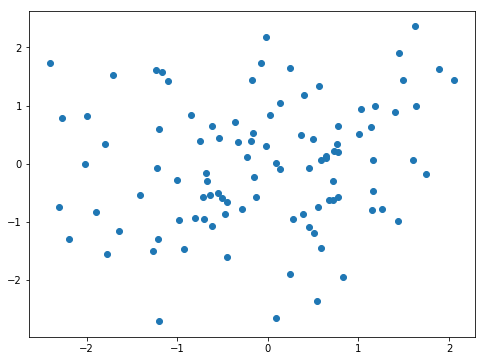
In [45]: plt.scatter(np.random.randn(100),np.random.randn(100))
Out[45]:
作业试题:
Problem 4

def jumpAndBackpedal(isMyNumber):
    '''
    isMyNumber: Procedure that hides a secret number.
     It takes as a parameter one number and returns:
     *  -1 if the number is less than the secret number
     *  0 if the number is equal to the secret number
     *  1 if the number is greater than the secret number

    returns: integer, the secret number
    '''
    guess = 1
    if isMyNumber(guess) == 0:
        return guess
    foundNumber = False
    while not foundNumber and isMyNumber(guess):
        sign = isMyNumber(guess)
        if sign == -1:
            guess *= 2
        else:
            guess -= 1
  return guess
# PROBLEM 7-1

def insert(atMe, newFrob):
    """
   atMe: a Frob that is part of a doubly linked list
   newFrob:  a Frob with no links
   This procedure appropriately inserts newFrob into the linked list that atMe is a part of.
   """
    # The new chain element has the same name of atMe
    if newFrob.name == atMe.name:
        newFrob.after = atMe.after
        atMe.after = newFrob
        newFrob.before = atMe
        # The new chain element has a next element
        if newFrob.after:
            newFrob.after.before = newFrob

    # The new element chain name comes before atMe's name
    elif newFrob.name < atMe.name:
        # atMe is the head of the chain
        if not atMe.before:
            atMe.before = newFrob
            newFrob.after = atMe
        # atMe is not the head of the chain and its previous element equals newFrob
        elif atMe.before and atMe.before == newFrob.before:
            newFrob.after = atMe
            atMe.before = newFrob
            newFrob.before.after = newFrob
        else:
            # "normal" case
            newFrob.after = atMe
            insert(atMe.before, newFrob)

    # The new element chain name comes after atMe's name
    else:
        if atMe.after and atMe.after == newFrob.after:
            newFrob.before = atMe
            atMe.after = newFrob
            newFrob.after.before = newFrob
        elif atMe.after == None:
            atMe.after = newFrob
            newFrob.before = atMe
        else:
            newFrob.before = atMe
            insert(atMe.after, newFrob)

# PROBLEM 7-2

def findFront(start):
    """
   start: a Frob that is part of a doubly linked list
   returns: the Frob at the beginning of the linked list
   """
    if not start.getBefore():
        return start
    else:
return findFront(start.getBefore())
