图形初阶
- 使用图形
R是一个惊艳的图形构建平台。这里我特意使用了“构建”一词。在通常的交互式会话中,
你可以通过逐条输入语句构建图形,逐渐完善图形特征,直至得到想要的效果。
pdf("mygraph.pdf")
attach(mtcars)
plot(wt, mpg)
abline(lm(mpg ~ wt))
title("Regression of MPG on Weight")
detach(mtcars)
dev.off()
首句绑定了数据框mtcars。第二条语句打开了一个图形窗口并生成了一幅散点图,横轴表示车
身重量,纵轴为每加仑汽油行驶的英里数。第三句向图形添加了一条最优拟合曲线。第四句添加
了标题。最后一句为数据框解除了绑定。
除了pdf(),还可以使用函数win.metafile()、png()、jpeg()、bmp()、tiff()、xfig()
和postscript()将图形保存为其他格式。
可以使用函数dev.new()、dev.next()、dev.prev()、
dev.set()和dev.off()同时打开多个图形窗口,并选择将哪个输出发送到哪个窗口中。
-
一个简单的例子
 dose <- c(20, 30, 40, 45, 60)
 drugA <- c(16, 20, 27, 40, 60)
 drugB <- c(15, 18, 25, 31, 40)
 plot(dose, drugA, type = "b")
图形参数
我们可以通过修改称为图形参数的选项来自定义一幅图形的多个特征(字体、颜色、坐标轴、
标题)。 (修改图形参数的)一种方法是通过函数par()来指定这些选项。
opar <- par(no.readonly = TRUE)
par(lty = 2, pch = 17)
plot(dose, drugA, type = "b")
par(opar)
plot(dose, drugA, type="b", lty:2, pch:l7) #效果同上
- 符号和线条
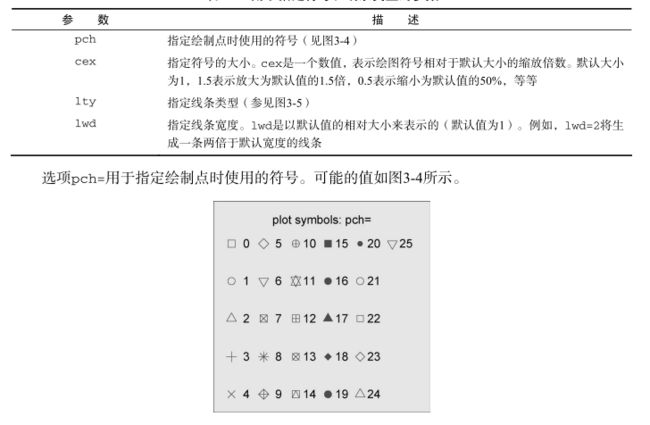
可以使用图形参数来指定绘图时使用的符号和线条类型。相关参数如表
- 颜色和文本参数
R中有若干和颜色相关的参数。
可以通过颜色下标、颜色名称、十六进制的颜色值、RGB值或HSV值来指定颜色。
举例来说,col=1、col="white"、col="#FFFFFF"、col=rgb(1,1,1)和col=hsv(0,0,1)
都是表示白色的等价方式。函数rgb()可基于红—绿—蓝三色值生成颜色,而hsv()则基于色相—
饱和度—亮度值来生成颜色。请参考这些函数的帮助以了解更多细节。
函数colors()可以返回所有可用颜色的名称。Earl F. Glynn为R中的色彩创建了一个优秀的
在线图表,参见http://research.stowers-institute.org/efg/R/Color/Chart。R中也有多种用于创建连续
型颜色向量的函数,包括rainbow()、heat.colors()、terrain.colors()、topo.colors()
以及cm.colors()。举例来说,rainbow(10)可以生成10种连续的“彩虹型”颜色。多阶灰度
色可使用gray()函数生成。这时要通过一个元素值为0和1之间的向量来指定各颜色的灰度。
gray(0:10/10)将生成10阶灰度色。
n <- 10
mycolors <- rainbow(n)
pie(rep(1, n), labels = mycolors, col = mycolors)
mygrays <- gray(0:n/n)
pie(rep(1, n), labels = mygrays, col = mygrays)
par(font.lab=3, cex.lab=l.5, font.main=4, cex.main=2)
- 图形尺寸与边界尺寸
dose <- c(20, 30, 40, 45, 60)
drugA <- c(16, 20, 27, 40, 60)
drugB <- c(15, 18, 25, 31, 40)
opar <- par(no.readonly = TRUE)
par(pin = c(2, 3))
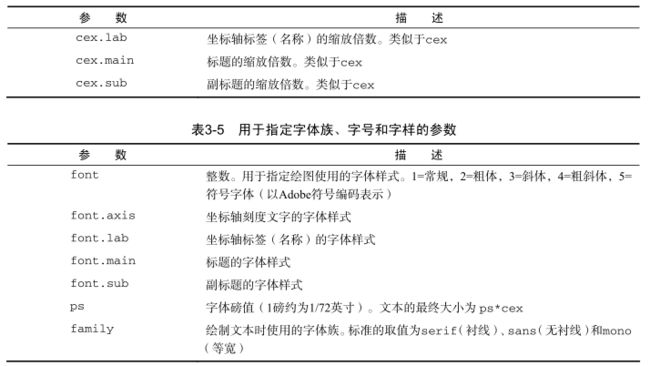
par(lwd = 2, cex = 1.5)
par(cex.axis = 0.75, font.axis = 3)
plot(dose, drugA, type = "b", pch = 19, lty = 2, col = "red")
plot(dose, drugB, type = "b", pch = 23, lty = 6, col = "blue",
bg = "green")
par(opar)
- 添加文本、自定义坐标轴和图例
除了图形参数,许多高级绘图函数(例如plot、hist、boxplot)也允许自行设定坐标轴
和文本标注选项。举例来说,以下代码在图形上添加了标题(main)、副标题(sub)、坐标轴标
签(xlab、ylab)并指定了坐标轴范围(xlim、ylim)
plot(dose, drugA, type = "b", col = "red", lty = 2,
pch = 2, lwd = 2, main = "Clinical Trials for Drug A",
sub = "This is hypothetical data",
xlab = "Dosage", ylab = "Drug Response", xlim = c(0, 60),
ylim = c(0, 70))
可以使用title()函数为图形添加标题和坐标轴标签。
title(main:"main title", sub="sub—title",
xlab="x—aXis label", ylab="y—axis label")
x <- c(1:10)
 y <- x
z <- 10/x
opar <- par(no.readonly = TRUE)
par(mar = c(5, 4, 4, 8) + 0.1)

plot(x, y, type = "b", pch = 21, col = "red", yaxt = "n",
lty = 3, ann = FALSE)
lines(x, z, type = "b", pch = 22, col = "blue", lty = 2)
axis(2, at = x, labels = x, col.axis = "red", las = 2)
axis(4, at = z, labels = round(z, digits = 2), col.axis = "blue",
las = 2, cex.axis = 0.7, tck = -0.01)
mtext("y=1/x", side = 4, line = 3, cex.lab = 1, las = 2,
col = "blue")
title("An Example of Creative Axes", xlab = "X values",
ylab = "Y=X")
par(opar)
- 参考线
函数abline()可以用来为图形添加参考线。函数abline()中也可以指定其他图形参数(如线条类型、颜色和宽度)
abline(h=yvalues, v=xvalues)
abline(h=c(l,5,7))
abline(v=seq(l, 10, 2), lty=2, col="blue")
- 图例
当图形中包含的数据不止一组时,图例可以帮助你辨别出每个条形、扇形区域或折线各代表
哪一类数据。
legend(location, title, legend, ...)
dose <- c(20, 30, 40, 45, 60)
drugA <- c(16, 20, 27, 40, 60)
drugB <- c(15, 18, 25, 31, 40)
opar <- par(no.readonly = TRUE)
par(lwd = 2, cex = 1.5, font.lab = 2)
plot(dose, drugA, type = "b", pch = 15, lty = 1, col = "red",
ylim = c(0, 60), main = "Drug A vs. Drug B", xlab = "Drug Dosage",
ylab = "Drug Response")
lines(dose, drugB, type = "b", pch = 17, lty = 2,
col = "blue")
abline(h = c(30), lwd = 1.5, lty = 2, col = "grey")
library(Hmisc)  #添加次刻度
minor.tick(nx = 3, ny = 3, tick.ratio = 0.5)
legend("topleft", inset = 0.05, title = "Drug Type",
c("A", "B"), lty = c(1, 2), pch = c(15, 17), col = c("red",
    "blue"))
par(opar)
- 图形的组合
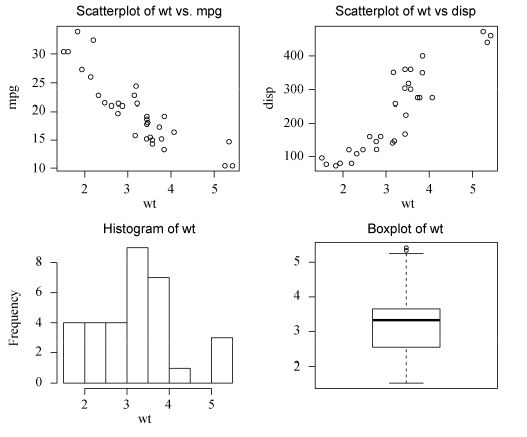
在R中使用函数par()或layout()可以容易地组合多幅图形为一幅总括图形。此时请不要担
心所要组合图形的具体类型,这里我们只关注组合它们的一般方法。par()函数中使用图形参数mfrow=c(nrows, ncols)来创建按行填充的、行数为
nrows、列数为ncols的图形矩阵。另外,可以使用nfcol=c(nrows, ncols)按列填充矩阵。
attach(mtcars)
opar <- par(no.readonly = TRUE)
par(mfrow = c(2, 2))
plot(wt, mpg, main = "Scatterplot of wt vs. mpg")
plot(wt, disp, main = "Scatterplot of wt vs disp")
hist(wt, main = "Histogram of wt")
boxplot(wt, main = "Boxplot of wt")
par(opar)
detach(mtcars)
函数layout()的调用形式为layout(mat),其中的mat是一个矩阵,它指定了所要组合的
多个图形的所在位置。在以下代码中,一幅图被置于第1行,另两幅图则被置于第2行:
attach(mtcars)
layout(matrix(c(1, 1, 2, 3), 2, 2, byrow = TRUE))
hist(wt)
hist(mpg)
hist(disp)
detach(mtcars)
为了更精确地控制每幅图形的大小,可以有选择地在layout()函数中使用widths=和
heights=两个参数。其形式为:
widths = 各列宽度值组成的一个向量
heights = 各行高度值组成的一个向量
attach(mtcars)
layout(matrix(c(1, 1, 2, 3), 2, 2, byrow = TRUE),
widths = c(3, 1), heights = c(1, 2))
hist(wt)
hist(mpg)
hist(disp)
detach(mtcars)
图形布局的精细控制
可能有很多时候,你想通过排布或叠加若干图形来创建单幅的、有意义的图形,这需要有对
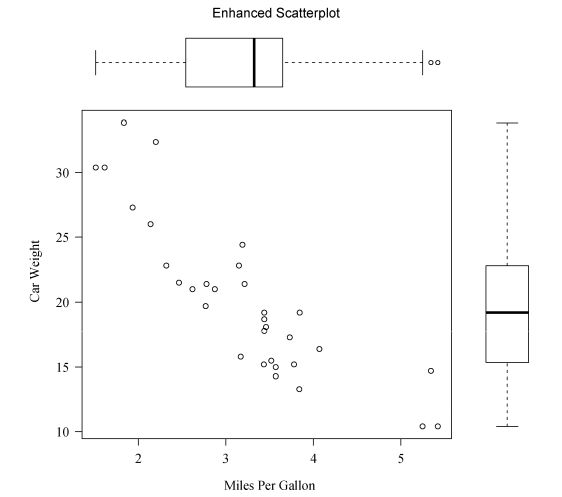
图形布局的精细控制能力。你可以使用图形参数fig=完成这个任务。
opar <- par(no.readonly = TRUE)
par(fig = c(0, 0.8, 0, 0.8))
plot(mtcars$wt, mtcars$mpg, xlab = "Miles Per Gallon",
ylab = "Car Weight")
par(fig = c(0, 0.8, 0.55, 1), new = TRUE)
boxplot(mtcars$wt, horizontal = TRUE, axes = FALSE)
par(fig = c(0.65, 1, 0, 0.8), new = TRUE)
boxplot(mtcars$mpg, axes = FALSE)
mtext("Enhanced Scatterplot", side = 3, outer = TRUE,
line = -3)
par(opar)
要理解这幅图的绘制原理,请试想完整的绘图区域:左下角坐标为(0,0),而右上角坐标为
(1,1)。图3-19是一幅示意图。参数fig=的取值是一个形如c(x1, x2, y1, y2)的数值向量。


