使用ggdotplot函数绘制点图
加载所需R包
library(ggpubr)
基本用法:
Usage
ggdotplot(data, x, y, combine = FALSE, merge = FALSE, color = "black",

 fill = "lightgray", palette = NULL, title = NULL, xlab = NULL,

 ylab = NULL, facet.by = NULL, panel.labs = NULL,

 short.panel.labs = TRUE, size = NULL, binwidth = NULL, select = NULL,

 remove = NULL, order = NULL, add = "mean_se", add.params = list(),

 error.plot = "pointrange", label = NULL, font.label = list(size = 11, color = "black"),

 label.select = NULL, repel = FALSE,

 label.rectangle = FALSE, ggtheme = theme_pubr(), ...)
常用参数:
Arguments
data #所需数据框 a data frame

x  #变量x character string containing the name of x variable.

y  #变量y character vector containing one or more variables to plot.

combine  #对于多类型数据是否分面 logical value. Default is FALSE. Used only when y is a vector containing multiple variables to plot. If TRUE, create a multi-panel plot by combining the plot of y variables.

merge  #对于对类型数据是否合并 logical or character value. Default is FALSE. Used only when y is a vector containing multiple variables to plot. If TRUE, merge multiple y variables in the same plotting area. Allowed values include also "asis" (TRUE) and "flip". If merge = "flip", then y variables are used as x tick labels and the x variable is used as grouping variable.

color, fill  #线条颜色与填充色 histogram line color and fill color.

palette  #自定义颜色画板 the color palette to be used for coloring or filling by groups. Allowed values include "grey" for grey color palettes; brewer palettes e.g. "RdBu", "Blues", ...; or custom color palette e.g. c("blue", "red"); and scientific journal palettes from ggsci R package, e.g.: "npg", "aaas", "lancet", "jco", "ucscgb", "uchicago", "simpsons" and "rickandmorty".

title  #设置标题 plot main title.

xlab #设置x轴标题 character vector specifying x axis labels. Use xlab = FALSE to hide xlab.

ylab #设置y轴标题character vector specifying y axis labels. Use ylab = FALSE to hide ylab.

facet.by #设置分组分面 character vector, of length 1 or 2, specifying grouping variables for faceting the plot into multiple panels. Should be in the data.

panel.labs #设置分面各组的标题 a list of one or two character vectors to modify facet panel labels. For example, panel.labs = list(sex = c("Male", "Female")) specifies the labels for the "sex" variable. For two grouping variables, you can use for example panel.labs = list(sex = c("Male", "Female"), rx = c("Obs", "Lev", "Lev2") ).

short.panel.labs #logical value. Default is TRUE. If TRUE, create short labels for panels by omitting variable names; in other words panels will be labelled only by variable grouping levels.

size #大小 Numeric value (e.g.: size = 1). change the size of points and outlines.

binwidth #bin的宽度 numeric value specifying bin width. use value between 0 and 1 when you have a strong dense dotplot. For example binwidth = 0.2\. http://r4ds.had.co.nz/eda.html).

select #选择需要展示的变量 character vector specifying which items to display.

remove #移除不需要展示的变量 character vector specifying which items to remove from the plot.

order  #选定变量的排列顺序 character vector specifying the order of items.

add  #character vector for adding another plot element (e.g.: dot plot or error bars). Allowed values are one or the combination of: "none", "dotplot", "jitter", "boxplot", "point", "mean", "mean_se", "mean_sd", "mean_ci", "mean_range", "median", "median_iqr", "median_mad", "median_range"; see ?desc_statby for more details.

add.params #添加其他参数 parameters (color, size, linetype) for the argument 'add'; e.g.: add.params = list(color = "red").

error.plot #添加误差棒 plot type used to visualize error. Allowed values are one of c("pointrange", "linerange", "crossbar", "errorbar", "upper_errorbar", "lower_errorbar", "upper_pointrange", "lower_pointrange", "upper_linerange", "lower_linerange"). Default value is "pointrange" or "errorbar". Used only when add != "none" and add contains one "mean_*" or "med_*" where "*" = sd, se, ....

label  #设置列标签 the name of the column containing point labels. Can be also a character vector with length = nrow(data).

font.label #设置标签字体 a list which can contain the combination of the following elements: the size (e.g.: 14), the style (e.g.: "plain", "bold", "italic", "bold.italic") and the color (e.g.: "red") of labels. For example font.label = list(size = 14, face = "bold", color ="red"). To specify only the size and the style, use font.label = list(size = 14, face = "plain").

repel  #是否避字体免重叠 a logical value, whether to use ggrepel to avoid overplotting text labels or not.

label.rectangle  #是否给标签添加方框 logical value. If TRUE, add rectangle underneath the text, making it easier to read.

ggtheme  #设置画图主题 function, ggplot2 theme name. Default value is theme_pubr(). Allowed values include ggplot2 official themes: theme_gray(), theme_bw(), theme_minimal(), theme_classic(), theme_void(), ....

...  #设置其他参数 other arguments to be passed to geom_histogram and ggpar.
使用示例
Examples
# Load data 加载数据
data("ToothGrowth")
df <- ToothGrowth
head(df)
## len supp dose
## 1 4.2  VC 0.5
## 2 11.5  VC 0.5
## 3 7.3  VC 0.5
## 4 5.8  VC 0.5
## 5 6.4  VC 0.5
## 6 10.0  VC 0.5

# Basic plot with summary statistics : mean_sd 添加均值和标均差
p0 <- ggdotplot(df, x = "dose", y = "len")
p0
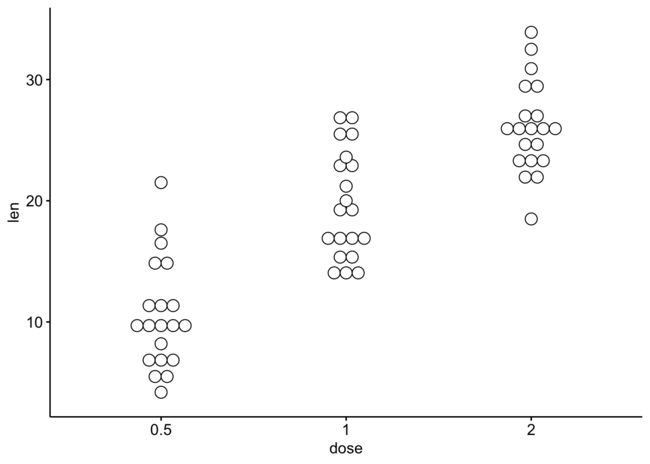
p0.png
p1 <- ggdotplot(df, x = "dose", y = "len", add = "mean_sd")
p1

p1.png
# Change error.plot to "crossbar" 误差棒设置为“crossbar”
p2 <- ggdotplot(df, x = "dose", y = "len", add = "mean_sd", add.params = list(width = 0.5), error.plot = "crossbar")
p2

p2.png
# Add box plot 添加箱线图
p3 <- ggdotplot(df, x = "dose", y = "len", add = "boxplot")
p3

p3.png
# Add violin + mean_sd 添加小提琴图和均值与标均差
p4 <- ggdotplot(df, x = "dose", y = "len", add = c("violin", "mean_sd"))
p4

p4.png
# Change colors 更改颜色
# Change fill and outline colors by groups: dose
# Use custom color palette
p5 <- ggdotplot(df, "dose", "len", add = "boxplot", color = "dose", fill = "dose", palette = c("#00AFBB", "#E7B800", "#FC4E07"))
p5

p5.png
p6 <- ggdotplot(df, "dose", "len", add = c("violin","mean_sd"), color = "dose", fill = "dose", palette = c("#00AFBB", "#E7B800", "#FC4E07"))
p6

p6.png
# Plot with multiple groups 设置分组和分面
# Change color by a second group : "supp"
p7 <- ggdotplot(df, "dose", "len", fill = "supp", color = "supp", palette = c("#00AFBB", "#E7B800"))
p7

p7.png
p8 <- ggdotplot(df, "dose", "len", fill = "supp", facet.by = "supp", add = "mean_sd", palette = c("#00AFBB", "#E7B800"))
p8

p8.png
参考来源:
https://www.rdocumentation.org/packages/ggpubr/versions/0.1.4/topics/ggdotplot
sessionInfo()
## R version 3.5.1 (2018-07-02)
## Platform: x86_64-apple-darwin15.6.0 (64-bit)
## Running under: OS X El Capitan 10.11.3
##
## Matrix products: default
## BLAS: /Library/Frameworks/R.framework/Versions/3.5/Resources/lib/libRblas.0.dylib
## LAPACK: /Library/Frameworks/R.framework/Versions/3.5/Resources/lib/libRlapack.dylib
##
## locale:
## [1] zh_CN.UTF-8/zh_CN.UTF-8/zh_CN.UTF-8/C/zh_CN.UTF-8/zh_CN.UTF-8
##
## attached base packages:
## [1] stats  graphics grDevices utils  datasets methods  base
##
## other attached packages:
## [1] ggpubr_0.1.7.999 magrittr_1.5  ggplot2_3.0.0
##
## loaded via a namespace (and not attached):
## [1] Rcpp_0.12.18  rstudioapi_0.7  bindr_0.1.1 knitr_1.20
## [5] tidyselect_0.2.4 munsell_0.5.0 colorspace_1.3-2 R6_2.2.2
## [9] rlang_0.2.2 stringr_1.3.1 plyr_1.8.4  dplyr_0.7.6
## [13] tools_3.5.1 grid_3.5.1  gtable_0.2.0  withr_2.1.2
## [17] htmltools_0.3.6 assertthat_0.2.0 yaml_2.2.0  lazyeval_0.2.1
## [21] rprojroot_1.3-2 digest_0.6.16 tibble_1.4.2  crayon_1.3.4
## [25] bindrcpp_0.2.2  purrr_0.2.5 glue_1.3.0  evaluate_0.11
## [29] rmarkdown_1.10  labeling_0.3  stringi_1.2.4 compiler_3.5.1
## [33] pillar_1.3.0  scales_1.0.0  backports_1.1.2 pkgconfig_2.0.2