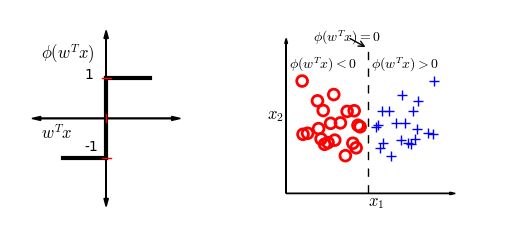
import numpy as np
import matplotlib.pyplot as plt
fig, axes = plt.subplots(1,2)
ax0, ax1 = axes
fig.set_figwidth = 10
fig.set_figheight = 10
ax0.plot([0, 1], [1, 1], color = 'black',linewidth = 3)
ax0.plot([0, -1], [-1, -1], color = 'black',linewidth = 3)
ax0.plot([0, 0], [-1, 1], color = 'black',linewidth = 3)
ax0.arrow(0,-2, 0, 4, fc="k", ec="k",head_width=0.1, head_length=0.2)
ax0.arrow(0,2, 0, -4, fc="k", ec="k",head_width=0.1, head_length=0.2)
ax0.arrow(-1.5,0, 3, 0, fc="k", ec="k",head_width=0.1, head_length=0.2)
ax0.arrow(1.5,0, -3, 0, fc="k", ec="k",head_width=0.1, head_length=0.2)
ax0.text(-0.5, 1,r'1')
ax0.text(-0.5, -0.8,r'-1')
ax0.text(-1.5, -0.5,r'$w^Tx$', fontsize=12)
ax0.axis([-2.5, 2.5, -2.5, 2.5])
ax0.plot([-0.1, 0.1], [1, 1], color='r')
ax0.plot([-0.1, 0.1], [-1, -1], color='r')
ax0.plot([0, 0], [-0.1, 0.1], color='r')
ax0.set_axis_off()
ax0.text(-1.5, 1.5, r'$\phi(w^Tx)$', fontsize=12)

ax1.axis([-4, 4, -4, 4])
ax1.arrow(-3,-3, 6, 0, fc="k", ec="k",head_width=0.1, head_length=0.2)
ax1.arrow(-3,-3, 0, 6, fc="k", ec="k",head_width=0.1, head_length=0.2)
ax1.text(0, -3.5,r'$x_1$',fontsize=12)
ax1.text(-3.7, 0,r'$x_2$', fontsize=12)
ax1.plot([0, 0], [-3, 2.9], 'k--')

N = 20
X,Y,scale = rand(N)*(-2.5)-0.2, (rand(N)-0.5)*3, 60
colors1 = ['red']*N
colors2 = ['green']*N

ax1.set_axis_off()
ax1.scatter(X, Y,c = "none",s=scale,alpha=1,marker='o', edgecolors=colors1, linewidth = 2)
ax1.scatter(-X, Y,s=scale,alpha=1,marker='+', edgecolors=colors2, linewidth = 1)
ax1.text(-2.9, 2, r'$\phi(w^Tx)<0$', fontsize=10)
ax1.text(0.1, 2, r'$\phi(w^Tx)>0$', fontsize=10)
ax1.annotate(r'$\phi(w^Tx)=0$',xy=(0,2.8),xytext=(-2,3.1),arrowprops=dict(arrowstyle='->', facecolor='blue'))
plt.subplots_adjust(left=0.1, right= 0.9, bottom=0.1, top=0.6)
plt.show()
427424d4-b43b-4231-8092-784cfc6d35ab.png
